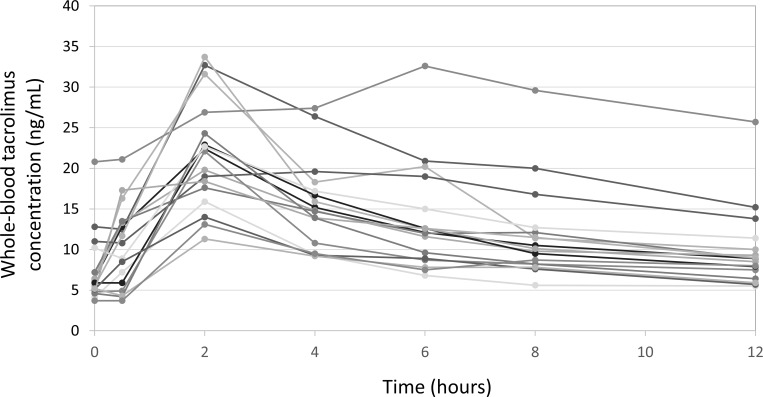
Fig 5. A total of 17 tacrolimus concentration-time curves completed with data from the 5 validation group patients.
The x-axis represents time points after oral administration of once-daily tacrolimus. The y-axis represents the whole-blood tacrolimus level. Blood tacrolimus concentrations rose to Cmax at 2 hours post-administration and gradually decreased thereafter.

