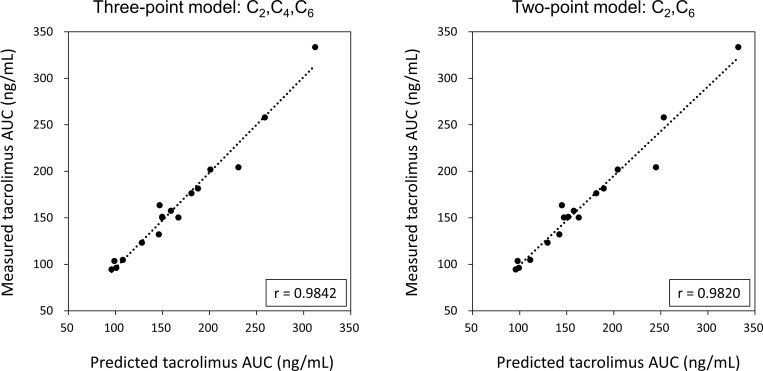
Fig 6. Scatter plots of predictive AUC on the x-axis versus measured AUC on the y-axis.
The predicted AUC estimated with a multiple regression equation provided the closest approximation to the actual value of AUC0-12 using the three time points C2, C4, and C6, and almost exactly the same result was obtained using the two time points C2 and C6.

