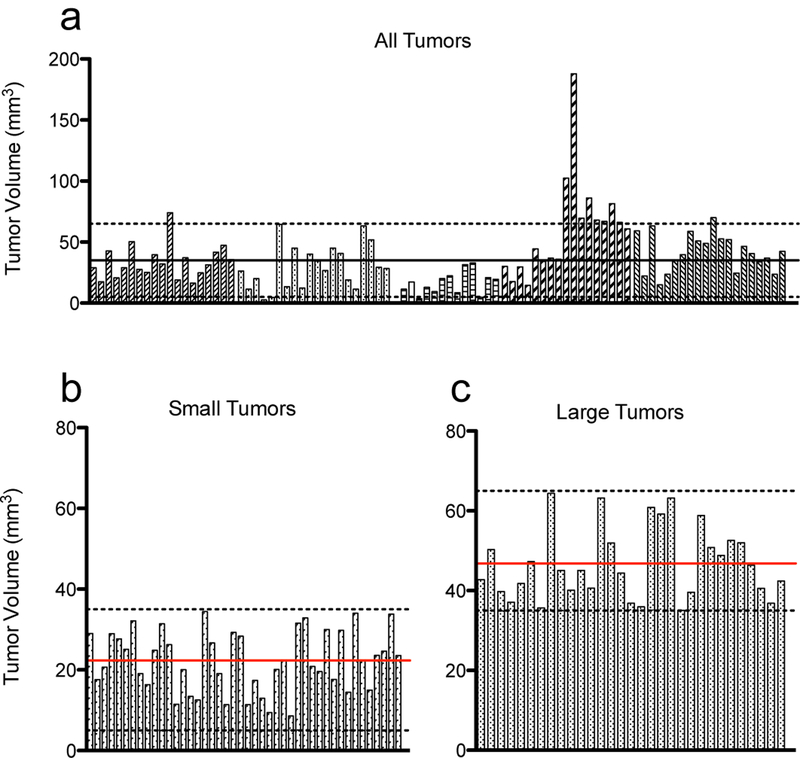
Figure 3.
Tumor size variation eight days post MiaPaCa-2 orthotopic implantation. (a) Tumors were implanted in 5 separate batches, each denoted by a different patterned bar. Each bar represents an individual tumor and its volume measured by ultrasound. Dotted lines are 5 mm3 and 65 mm3, and tumors that fell within this range were included in subsequent longitudinal analysis. The black line denotes the size cutoff of 35 mm3 for large and small tumors. (b,c) Separation of tumors into small and large tumor size groups, respectively. Dotted lines represent the cutoff sizes for each group (5–35 mm3 in B, 35–65 mm3 in C). Red lines denote the average size of tumors in that group, 22.3 mm3 for small tumors, and 46.8 mm3 for large tumors.

