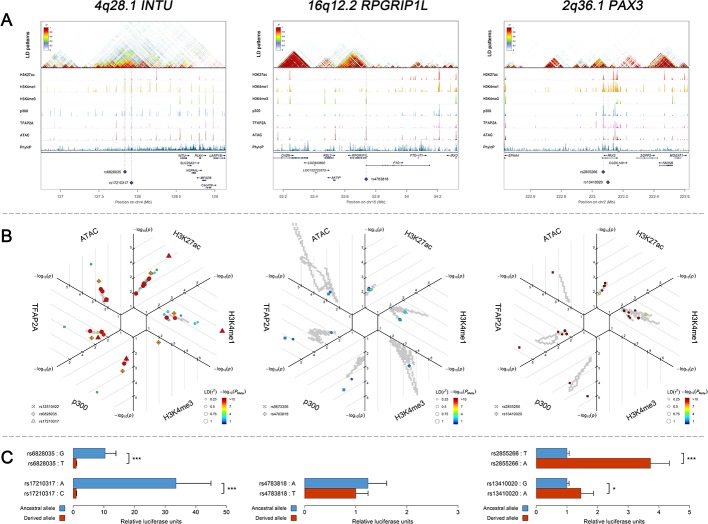
Figure 5. Three examples of genetic loci associated with facial shape phenotypes.
Three examples of facial shape associated loci we discovered are depicted in details, including two novel loci (INTU; RPGRIP1L) and one (PAX3) that overlaps with previous face GWAS findings. The figure is composed by three layers (A–C) organized from the top to the bottom. (A) Denotes the linkage disequilibrium (LD) patterns (r2) of EUR in the corresponding regions and epigenetic annotation of CNCC’s regulatory elements in corresponding regions using WashU Epigenome Browser. Chip-seq profiles display histone modifications associated with active enhancers (H3K27ac, H3K4me1) or promoters (H3K4me3), and binding of general coactivator p300 and transcription factor TFAP2A. The ATAC-seq track shows chromatin accessibility. The PhyloP track indicates cross-species conservation. (B) SNPs in LD (r2 > 0.25) with the top-associated SNP and all base-pairs in vicinity (within 20 kb, p<0.05) are displayed according to their log scaled quantile rank (-log10p, axis scale) in the circular figure, where the rank is calculated using the Chip-seq values in the whole genome. In addition, SNPs associated with facial phenotypes in our meta-analysis of GWASs were highlighted according to their association p values (PMeta, color scale) and their LD (r2) with the top-associated SNP in the region (points size). (C) Shows results of luciferase reporter assays in CD271+ neural crest progenitor cells by which we tested allele-specific enhancer activity of putative enhancers surrounding the selected SNPs using the Student´s t-test. Data are presented as relative luciferase activity (firefly/renilla activity ratio) fold change compared to the construct containing less active allele. Similar figures for layers A and B are provided for all face associated loci in Figure 2—figure supplements 1–24.


