
Figure 1. AD neurons show enhanced excitability compared to isogenic control neurons.
(A) Spontaneous action potentials (sAP) at resting membrane potential (RMP). WT/WT hiPSC-derived cerebrocortical neuron data in black, M146V/WT and APPswe/WT in red. (B) Quantification of sAP frequency. (C) Evoked APs in neurons hyperpolarized to −60 mV. Single traces (insets). (D–H) Neuronal membrane and AP properties. Quantification of resting membrane potential (RMP, (D), AP threshold (APthreshold, (E); AP height (F); width at AP half height (G); AP decay slope (H). (I). Quantification of cell capacitance (Cm), reflecting neuronal size. Data are mean ± SEM. Statistical significance analyzed by ANOVA with post hoc Dunnett’s test. Exact p values for comparison to WT are listed in the bar graphs in this and subsequent figures. Unless otherwise stated, total number of neurons quantified is listed above the bars in this and subsequent electrophysiology figures.

Figure 1—figure supplement 1. AD hiPSC-derived neuronal cultures express cortical neuronal markers and aberrant Aβ levels compared to isogenic controls.
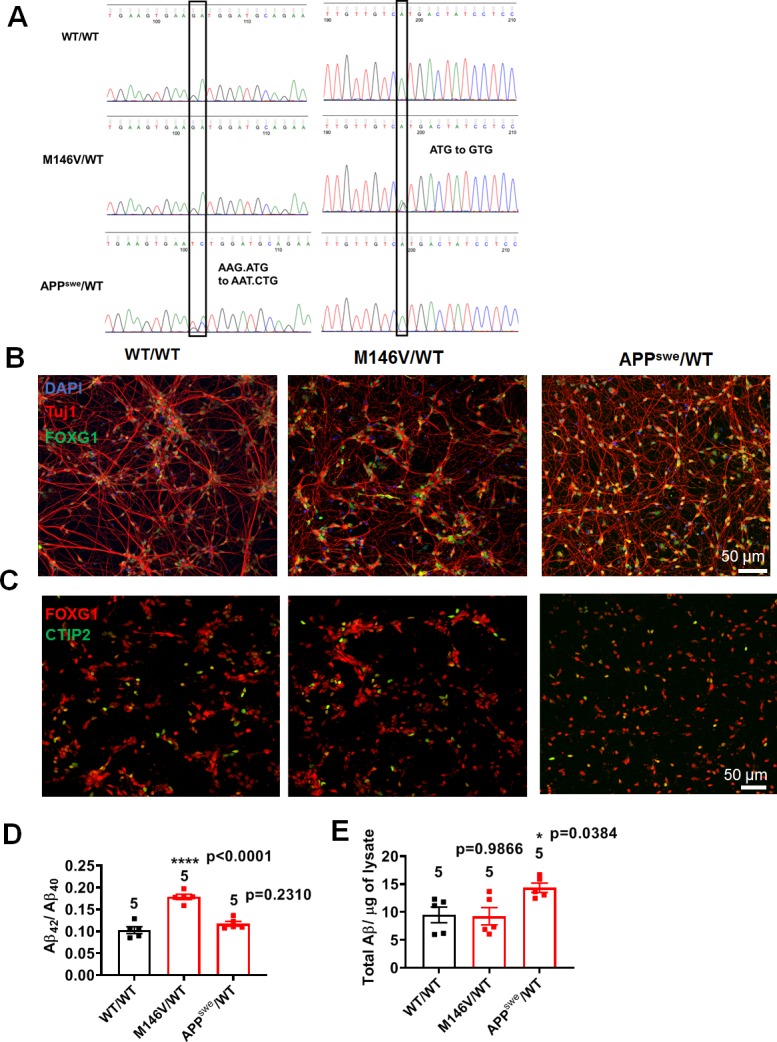
Figure 1—figure supplement 2. ΔE9/WT neurons show enhanced excitability compared to isogenic control neurons.
