. 2019 Nov 29;8:e50333. doi: 10.7554/eLife.50333

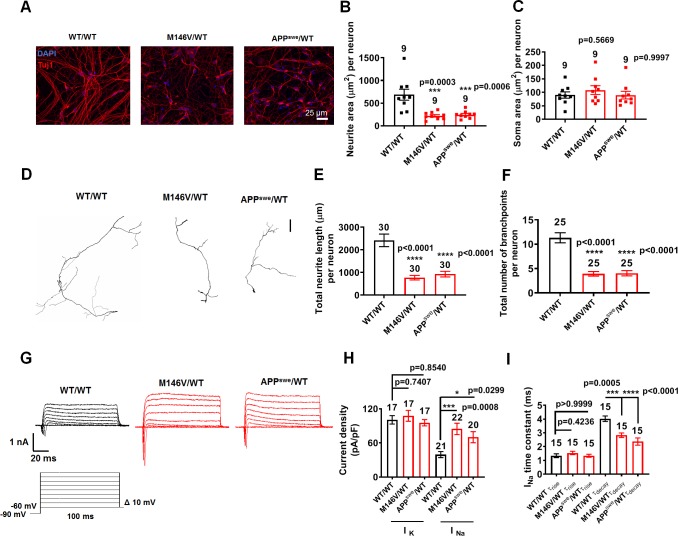
Figure 2. AD neurons show differences in morphology and sodium channel properties compared to WT neurons.

WT/WT hiPSC-derived cerebrocortical neuron data in black, M146V/WT and APPswe/WT in red at 5 weeks of culture. (A) Representative images of cells expressing the neuronal marker Tuj1. (B) Quantification of area covered by neurites expressing Tuj1 normalized to total number of neurons. (C) Quantification of somal area normalized to total number of neurons. Total number of random fields of neuronal cultures analyzed in three separate experiments is listed above the bars in B,C. (D) Representative tracings of neurites from WT/WT, APPswe/WT, and M146V/WT AD lines. Scale bar: 100 µm. (E) Quantification of total neurite length. (F) Quantification of total number of neurite branchpoints. Total number of neurons analyzed in three separate neuronal cultures is listed above the bars in E,F. (G) Representative sodium and potassium currents recorded from neurons clamped at −70 mV. (H) Current densities. (I) Sodium current (INa) rise time (τrise) and decay time (τdecay). Data are mean ± SEM. Statistical significance analyzed by ANOVA with post hoc Dunnett’s test.

Figure 2—source data 1. Excel files containing data shown as summary bar graph in Figure 2E,F,H,I.

Figure 2.

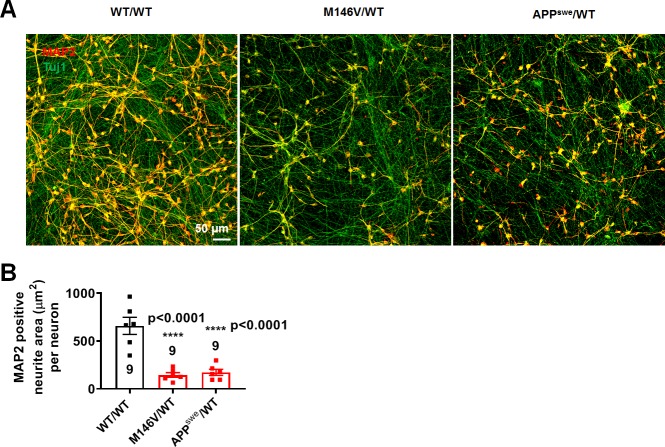
Figure 2—figure supplement 1. Changes in MAP2 and Tuj1 expression.

Figure 2—figure supplement 1.

(A) Representative images of neurons expressing MAP2 (red) and Tuj1 (green). (B) Quantification of area covered by neurites expressing MAP2 normalized to total number of Tuj1 and DAPI-positive neurons in nine random fields from three different cultures. Data are mean ± SEM. Statistical significance analyzed by ANOVA with post hoc Dunnett’s test (p<0.0001).
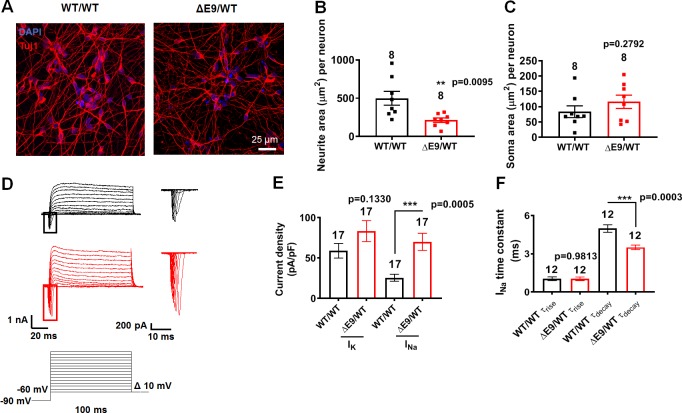
Figure 2—figure supplement 2. Changes in Tuj1 expression and sodium channel properties in ΔE9/WT neurons.

Figure 2—figure supplement 2.

(A) Representative images of neurons expressing Tuj1. (B) Quantification of area covered by neurites expressing Tuj1 normalized to total number of neurons. (C) Quantification of somal area normalized to total number of neurons. Total number of random fields of neuronal cultures analyzed in three separate experiments is listed above the bars in B,C. (D) Representative sodium and potassium currents recorded from neurons voltage-clamped at −70 mV. Magnified sodium current traces shown at right. WT/WT hiPSC-derived cerebrocortical neuron data in black, ΔE9/WT AD neurons in red. (E) Sodium (INa) and potassium (IK) current densities. (F) INa rise time (τrise) and decay time (τdecay). Data are mean ± SEM. Statistical significance analyzed by two-tailed unpaired Student’s t-test.