. 2019 Nov 29;8:e50333. doi: 10.7554/eLife.50333

Figure 3. Developmental timeline of AD neurons compared to isogenic control neurons.

WT/WT hiPSC-derived cerebrocortical neuron data in black, M146V/WT and APPswe/WT AD neurons in red. (A–C) Representative evoked APs and sodium/potassium currents recorded from WT/WT (A), M146V/WT (B), and APPswe/WT (C) hiPSC-derived cerebrocortical neurons in culture for 2 weeks (Left), 4 weeks (Middle) and 6 weeks (Right). (D) Sodium (INa) and potassium (IK) current densities. (E) Quantification of cell capacitance (Cm). Note that potassium current density and cell size were significantly greater in M146V/WT compared to WT/WT at the 2 week timepoint, but at later timepoints there was no difference in potassium current density but the cell capacitance of AD neurons significantly decreased. Data are mean ± SEM. Statistical significance analyzed by ANOVA with post-hoc Dunnett’s test.

Figure 3—source data 1. Excel files containing data shown as summary bar graph in Figure 3D (2 weeks, 4 weeks and 6 weeks); Figure 3E (2 weeks, 4 weeks and 6 weeks).

Figure 3.

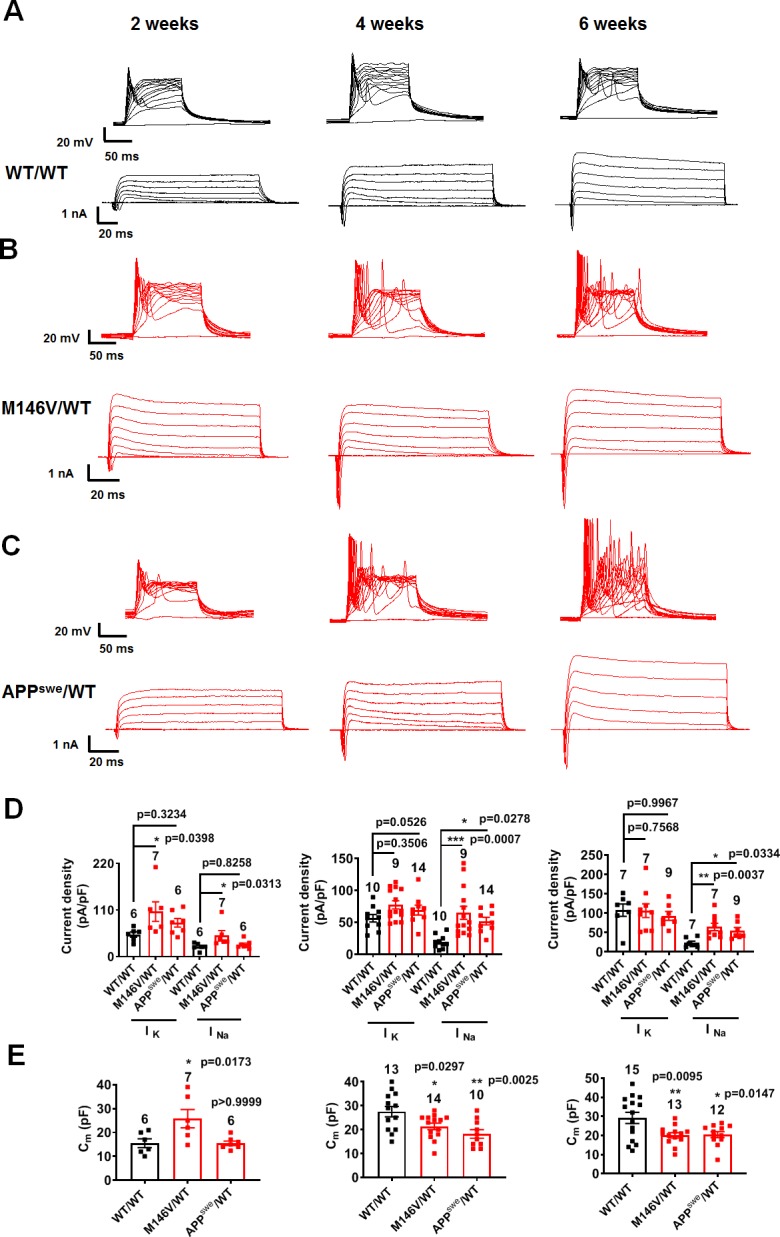
Figure 3—figure supplement 1. Developmental timeline of ΔE9/WT neurons compared to isogenic control neurons.

Figure 3—figure supplement 1.

(A,B) Representative evoked APs and sodium/potassium currents recorded from WT/WT (A) and ΔE9/WT (B) hiPSC-derived cerebrocortical neurons in culture for 2 weeks (left), 4 weeks (middle) and 6 weeks (right). (C) Sodium (INa) and potassium (IK) current densities. (D) Quantification of cell capacitance (Cm). Data are mean ± SEM. Statistical significance analyzed by two-tailed unpaired Student’s t-test.
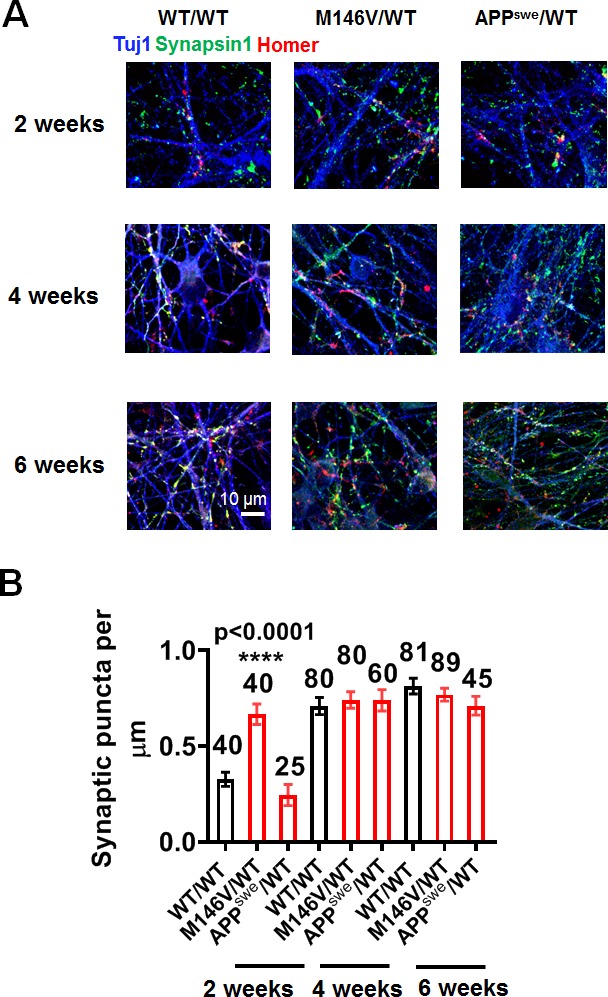
Figure 3—figure supplement 2. Synaptic development in hiPSC-derived AD neurons vs WT neurons.

Figure 3—figure supplement 2.

(A) Representative images showing presynaptic (synapsin; green) and postsynaptic (homer; red) staining in WT/WT, M146V/WT, and APPswe/WT cultures at 2 weeks, 4 weeks and 6 weeks. (B) Quantification of number of synapses, represented by colocalization of synapsin and homer puncta per µm of neurite length. Data are mean ± SEM. Statistical significance analyzed by ANOVA with post hoc Dunnett’s test. Total number of neurites analyzed for each condition listed above each bar for 4–5 experiments.