. 2019 Nov 29;8:e50333. doi: 10.7554/eLife.50333

Figure 4. AD neurons show disrupted excitatory synaptic transmission compared to isogenic control neurons.

(A) Representative spontaneous excitatory postsynaptic currents (sEPSC) recorded at −70 mV from WT/WT, M146V/WT and APPswe/WT hiPSC-derived cerebrocortical neurons in culture for 5 weeks. (B,C) Quantification of sEPSC parameters. Quantification of mean amplitude (B) and quantification of mean frequency (C). (D) Representative miniature excitatory postsynaptic currents (mEPSCs) recorded at −70 mV from WT/WT, M146V/WT and APPswe/WT hiPSC-derived cerebrocortical neurons at 5 weeks in culture. (E,F) Cumulative probability of mEPSC amplitude (inset: quantification of mean amplitude, E) and mEPSC inter-event interval (inset: quantification of mean frequency, -F). (G) Representative images of VGLUT1 immunostaining. (H) Quantification of VGLUT1 intensity normalized to Tuj1 intensity. Total number of random fields of neuronal cultures analyzed in three separate experiments is listed above the bars. (I) Representative western blot images showing VGLUT1 protein levels. (J) Ratio of VGLUT1/GAPDH normalized to the value of WT VGLUT1/GAPDH. Data are mean ± SEM. Statistical significance analyzed by ANOVA with post-hoc Dunnett’s test, or, for immunoblot analysis, by a Kruskal Wallis test followed by Dunn’s multiple comparisons (Deyts et al., 2016). Number of independent experiments listed above bars.

Figure 4—source data 1. Excel files containing data shown as summary bar graph in Figure 4B,C.

Figure 4.

Figure 4—figure supplement 1. ΔE9/WT neurons show increased excitatory synaptic activity compared to isogenic control neurons.

Figure 4—figure supplement 1.

WT/WT hiPSC-derived cerebrocortical neuron data in black, ΔE9/WT in red. (A) Representative images showing presynaptic (synapsin; green) and postsynaptic (homer; red) staining in WT/WT and ΔE9/WT cultures. (B) Quantification of number of synapses, represented by colocalization of synapsin (green) and homer (red) puncta per µm of neurite length. Total number of neurites analyzed in 4–5 experiments for each condition listed above bars. (C) Representative spontaneous excitatory postsynaptic current (sEPSC) recorded at −70 mV from WT/WT and ΔE9/WT hiPSC-derived cerebrocortical neurons in culture for 5 weeks. (D,E) Quantification of sEPSC parameters. Quantification of mean amplitude (D) and quantification of mean frequency (E). (F) Representative miniature excitatory postsynaptic currents (mEPSCs) recorded from WT/WT and ΔE9/WT hiPSC-derived cerebrocortical neurons at 5 weeks in culture. (G,H) Cumulative probability of mEPSC amplitude (inset: quantification of mean amplitude) and mEPSC inter-event interval (inset: quantification of mean frequency). (I) Representative images of VGLUT1 immunostaining. (J) Quantification of VGLUT1 intensity normalized to Tuj1 intensity. Total number of random fields of neuronal cultures analyzed in three separate experiments is listed above the bars. (K) Representative western blot images showing expression of VGLUT1. (L) Ratio of VGLUT1/GAPDH normalized to the value of WT VGLUT1/GAPDH. Data are mean ± SEM. Statistical significance analyzed by Student’s t test or, for immunoblot analysis, Mann Whitney U test. Number of independent experiments listed above bars in D, E, G, H, J and L.
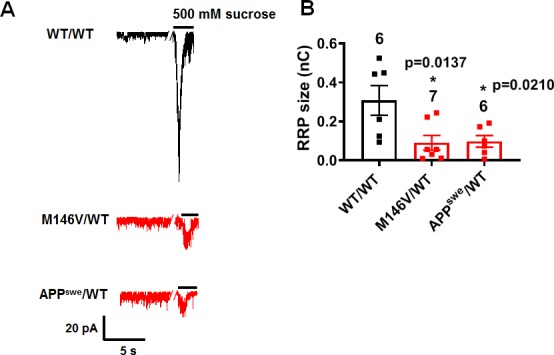
Figure 4—figure supplement 2. Depletion of readily releasable pool in AD and WT neurons.

Figure 4—figure supplement 2.

(A) Representative EPSC recorded at −70 mV upon application of 500 mM sucrose containing hypertonic solution in WT/WT, M146V/WT, and APPswe/WT hiPSC-derived AD cerebrocortical neurons in culture for 5 weeks. (B) Quantification of the readily releasable pool size (nC). Data are mean ± SEM. Statistical significance analyzed by ANOVA with post hoc Dunnett’s test.