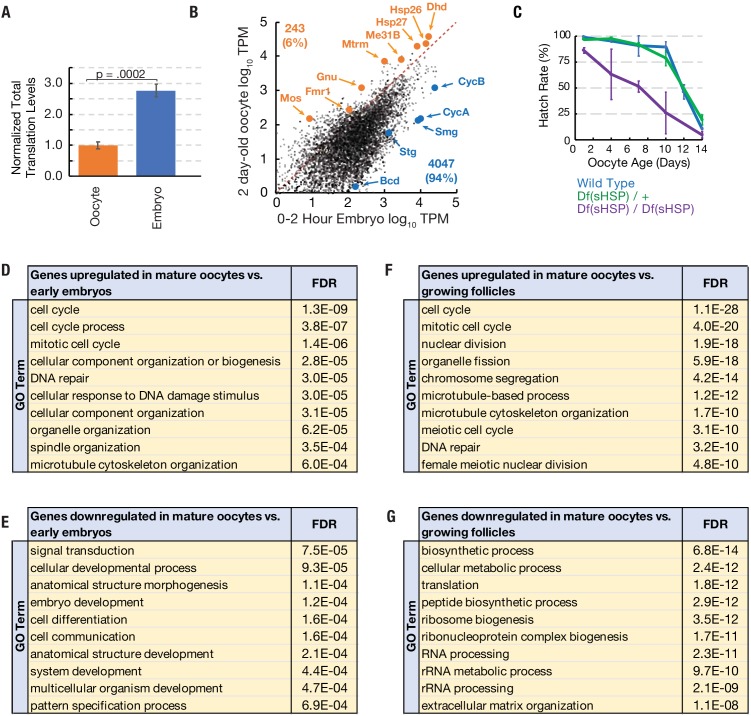
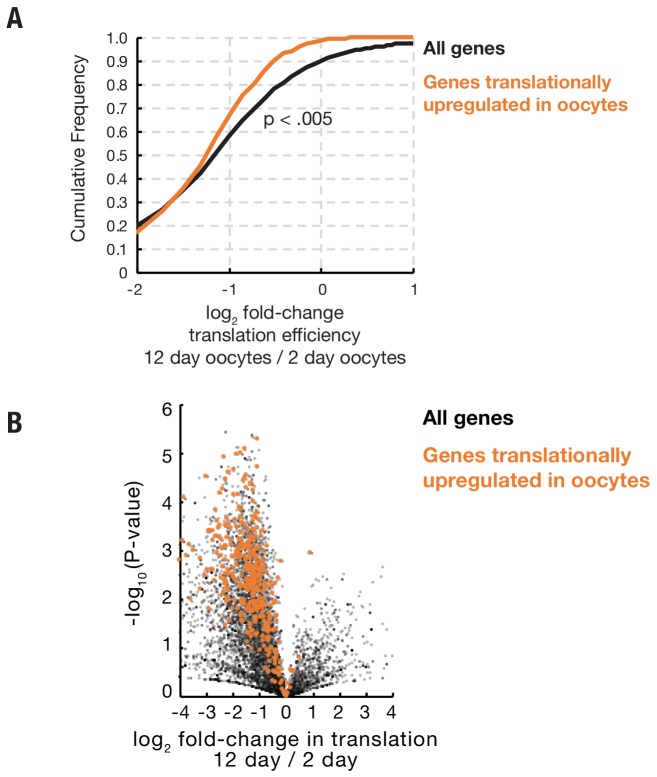
Figure 4. Translation of a small group of genes is boosted during oocyte arrest.
(A) Normalized total translation levels from ribosome profiling in 0–2 hr embryos compared to oocytes stored for two days. (B) Plot showing that most genes are translated at higher levels in the 0–2 hr embryo than the 2 day stored oocyte. Examples of the 243 more highly translated ‘pilot light genes’ are labeled in orange. (C) The hatch rate of stored oocytes from wild type (blue), Df(sHSP)/+ (green), or Df(sHSP)/Df(sHSP) (purple) females after indicated storage period (‘oocyte age’). Deletion of Hsp26 and Hsp27 accelerated the rate of decline during storage (N = 3 at each point). (D–G) GO analysis (PANTHER) of genes with significantly (p<0.01, Student’s t-test) increased (D,F) or decreased (E,G) translation in 2- day-old mature oocytes compared to 0–2-hr embryos (D,E) or growing follicles (F,G). Error bars in (A) and (C) denote SD. FDR = false discovery rate.
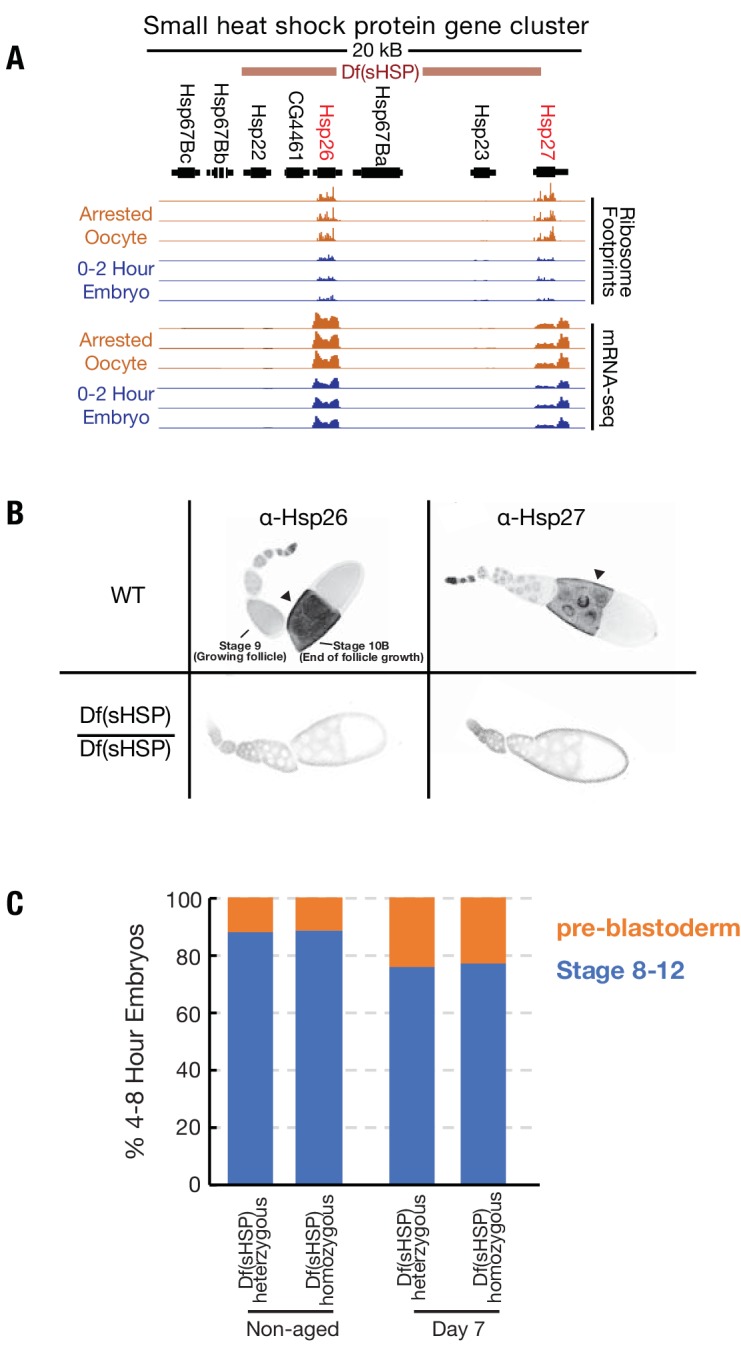
Figure 4—figure supplement 1. Deletion of the small heat shock protein gene locus.


