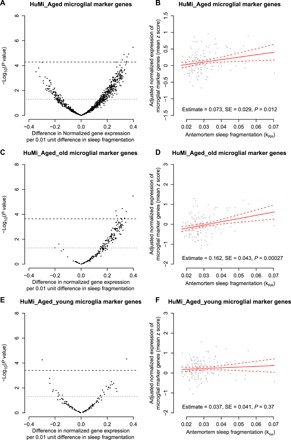
Fig. 1. Antemortem sleep fragmentation and expression of microglia marker genes.

(A and B) HuMi_Aged gene set. (C and D) HuMi_Aged genes enriched in aged microglia (HuMi_Aged_Old gene set). (E and F) HuMi_Aged genes enriched in young microglia (HuMi_Aged_Young gene set). (A, C, and E) Volcano plots of −log10(P value) versus effect size for normalized gene expression as a function of antemortem sleep fragmentation, controlling for age at death, sex, education, and methodological covariates. Each dot represents a single gene. Dotted line indicates unadjusted P < 0.05. Dashed line indicates Bonferroni corrected P < 0.05. (B, D, and F) Partial residual plot of microglial gene expression summary score as a function of antemortem sleep fragmentation adjusted for age, sex, education, and methodological covariates. Y axis is the composite expression for the gene set calculated as described in the text. X axis is average antemortem sleep fragmentation. Each dot represents a single sample. Solid line indicates the predicted composite gene expression for an average participant. Dotted lines indicate 95% CIs on the prediction.
