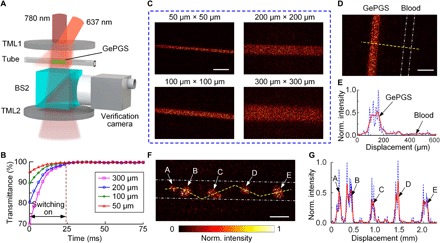
Fig. 3. In vitro demonstration of focusing light onto GePGS inside scattering media.

(A) Experimental setup for in vitro demonstration. TML, tissue-mimicking layer. (B) Normalized transmittance of the light passing through the tubes with different diameters filled with GePGS (300 μM). The inner dimensions of the square tubes were 50, 100, 200, and 300 μm. (C) Images of the focused light onto GePGS injected into the tubes with different sizes. Scale bar, 300 μm. (D) Image shows that light is focused only onto the GePGS, not blood. Two tubes filled with GePGS and blood are placed side by side. The white dash-dotted lines represent the inner walls of the tube filled with blood. The inner dimensions of the tubes were both 100 μm. Scale bar, 200 μm. (E) Normalized intensity distribution along the yellow dashed line in (D). The blue dashed line is the measured value, and the red solid line is the smoothed curve with a span of 10 points. (F) Image of the focused light onto a tube filled with U87 cells expressing GePGS. It shows that light is focused onto the GePGS-expressing cells/cell clusters. The white dash-dotted lines represent the inner walls of the tube. Scale bar, 300 μm. (G) Normalized intensity distribution along the yellow dashed line in (F). The blue dashed line is the measured value, and the red solid line is the smoothed curve with a span of 10 points.
