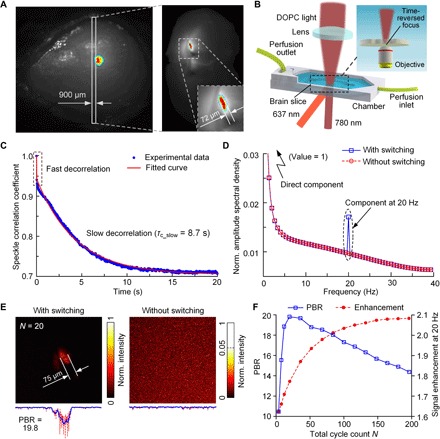
Fig. 5. Demonstration of focusing light inside brain slices.

(A) Fluorescence images of the transduced mouse brain in vivo, and a live brain slice showing expression of the GePGS. The differential fluorescence signals between the ON and OFF states highlight the brain tissue expressing RSBPs, which are shown in color, and the background signals are shown in gray. Excitation wavelength, 630 nm. (B) Schematic of the setup for focusing light inside brain slices. (C) Speckle correlation coefficient as a function of time for a live brain slice. Two speckle decorrelation characteristics are identified. (D) Normalized amplitude spectral density of the detected photons, where a peak is observed at 20 Hz with light switching. (E) Normalized intensity distributions of the optical foci inside a brain slice. Left, with 637-nm light switching for N = 20; right, without 637-nm light switching. (F) Signal enhancement of tagged photons (at 20 Hz) and the PBR of time-reversed focusing as a function of the total cycle count N.
