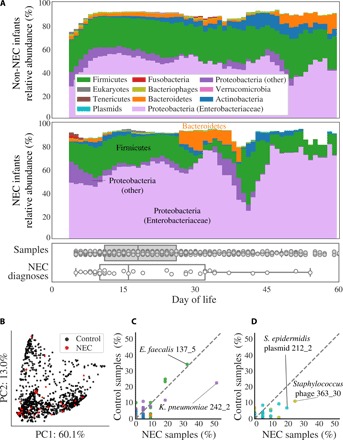
Fig. 2. Comparison of microbes in premature infants who do and do not develop NEC.

(A) The compositional profile of microbes colonizing infants who were and were not diagnosed with NEC. Bacteria were classified on the basis of their phyla, and other microbes were classified on the basis of their domain. Each color represents the percentage of reads mapping to all organisms belonging to a taxon, and the stacked boxes for each sample show the fraction of reads in that dataset accounted for by the genomes assembled from the sample. Proteobacteria were subdivided into the family Enterobacteriaceae and other. All relative abundance values were averaged over a 5-day sliding window. Boxplots show the DOL in which samples were collected (top) and in which infants were diagnosed with NEC (bottom). (B) Principal components analysis (PCA) based on weighted UniFrac distance for all samples from NEC infants (red) and control infants (black). (C and D) Percentage of NEC infants versus the percentage of non-NEC infants colonized by strains of (C) bacteria or (D) bacteriophage (gold) and plasmids (blue). The taxonomies of four strains with extreme values are provided, of which only K. pneumoniae strain 242_2 is significantly enriched in NEC samples (P < 0.05, Fisher’s exact test). Colonization by bacteria is defined as the presence of a strain at ≥0.1% relative abundance. Plasmid and bacteriophage detection required a read-based genome breadth of coverage of ≥50%. Each dot represents a strain, and dashed lines show a 1:1 colonization rate.
