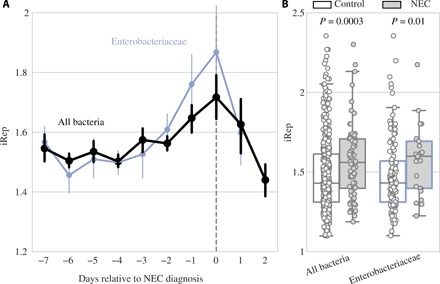
Fig. 3. Bacterial replication rates are significantly higher before NEC development.

(A) Replication rates for bacterial groups relative to day of NEC diagnosis. Dots represent the mean value for each group on each day, and error bars represent SEM. DOL in which growth rates were calculated from at least five infants are shown. (B) Growth rates in control (white) versus pre-NEC (gray) samples. P values shown from Wilcoxon rank sum test.
