
Fig. 2. Multiple TFH cell–associated genes are targeted by the miR-23~27~24 family.
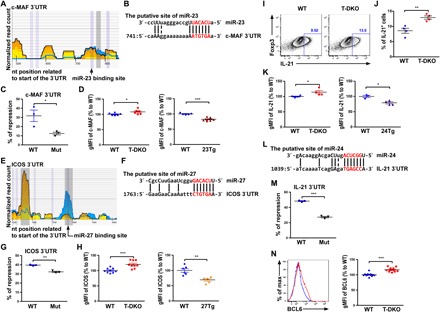
(A) HITS-CLIP analysis and (B) sequence alignment of putative miR-23 site in the 3′UTR of c-MAF. (C) Ratios of repressed luciferase activity of cells in the presence of c-MAF 3′UTR with or without mutations in the seed sequences in the presence of miR-23 compared with cells transfected with control miRNA. (D) Percentage of c-MAF geometric mean fluorescence intensity (gMFI) in CXCR5+PD1+TFH cells from T-DKO or 23Tg mice over WT littermates. (E) HITS-CLIP analysis and (F) sequence alignment of the putative miR-27 site in the 3′UTR of ICOS. (G) Ratios of repressed luciferase activity of cells in the presence of ICOS 3′UTR with or without mutations in the seed sequences in the presence of miR-27 compared with cells transfected with control miRNA. (H) Percentage of ICOS gMFI in CXCR5+PD1+TFH cells from T-DKO mice or 27Tg mice over WT littermates. (I) FACS analysis, (J) frequencies, and (K) percentage of IL-21 gMFI in in vitro–activated CD4+ T cells from T-DKO or 24Tg mice over WT littermates. (L) Sequence alignment of the putative miR-24 site in the 3′UTR of IL-21. (M) Ratios of repressed luciferase activity of cells in the presence of IL-21 3′UTR with or without mutations in the seed sequences in the presence of miR-24 compared with cells transfected with control miRNA. (N) FACS analysis and percentage of BCL6 gMFI in CXCR5+PD1+TFH cells from T-DKO or 24Tg mice over WT littermates. Data are representative of three independent experiments. Each symbol represents a mouse or cell sample, and the bar represents the mean. *P < 0.05, **P < 0.01, and ***P < 0.001. nt, nucleotide.