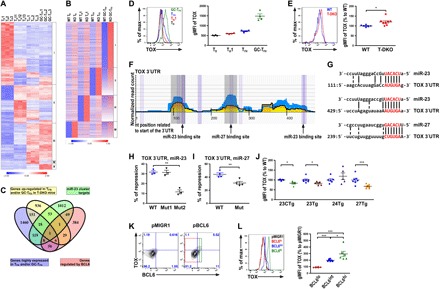
Fig. 3. miR-23 and miR-27 jointly repress TOX, a transcription factor that is highly up-regulated by BCL6 in TFH cells.

(A) RNA-seq analysis of genes that were differentially expressed in Tn1, TH1, TFH, and GC-TFH cells isolated from WT B6 mice 8 days after LCMV infection. (B) Genes that were up-regulated in different T-DKO T cell subsets compared to their corresponding WT counterparts were shown. (C) Venn diagram analysis of genes enriched in TFH and/or GC-TFH cells, further up-regulated in T-DKO TFH and/or GC-TFH cells, containing putative targets of the miR-23~27~24 family by HITS-CLIP and bound by BCL6 in TFH cells. FACS analysis and gMFI of TOX protein amounts in (D) different T cell subsets from WT B6 mice or (E) PSGLloCXCR5+ GC-TFH cells from T-DKO mice or WT littermates. (F) HITS-CLIP analysis and (G) sequence alignment of putative miR-23 and miR-27 sites in the 3′UTR of TOX. Ratios of repressed luciferase activity of cells in the presence of TOX 3′UTR with or without corresponding mutations in the seed sequences in the presence of (H) miR-23 or (I) miR-27 compared with cells transfected with control miRNA. (J) gMFI of TOX protein amounts in PSGLloCXCR5+ GC-TFH cells from 23CTg, 23Tg, 24Tg, or 27Tg mice and their corresponding WT littermates. (K) FACS analysis of TOX protein expression in BCL6-deficient T cells transduced with BCL6-expressing or control retroviral vectors. Cells that expressed different BCL6 amounts (lo, int., or hi) were individually gated. (L) FACS analysis and percentage of TOX gMFI in BCL6 lo, int., and hi populations from BCL6-reexpressing T cells over T cells transduced with control vector were shown. Data are representative of three independent experiments. Each symbol represents a mouse or cell sample, and the bar represents the mean. *P < 0.05, **P < 0.01, and ***P < 0.001.
