
Figure 4: Dorsally patterned organoids show sample-to-sample reproducibility similar to endogenous brains.
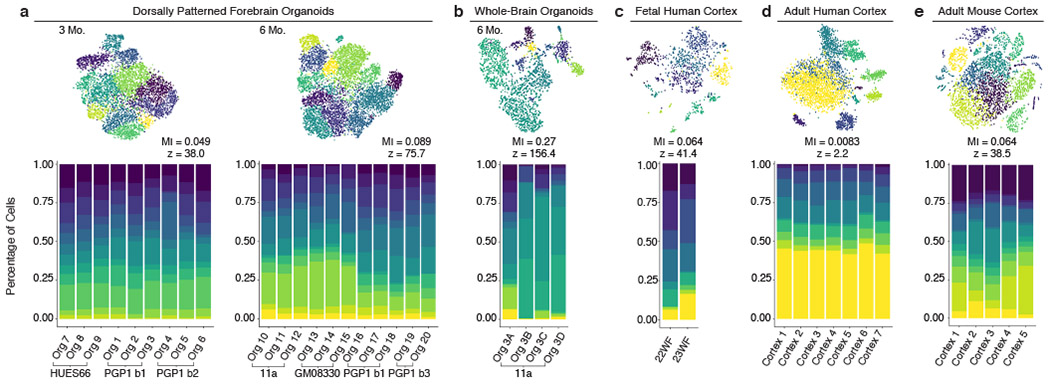
(a-e) Percent of cells from each individual organoid or endogenous cortex belonging to each cell cluster in identically processed datasets from a, dorsally patterned forebrain organoids at 3 months (3 batches, n=9 organoids) and 6 months (4 batches, n=11 organoids), b, self-patterned whole-brain organoids at 6 months3 (n=4), c, fetal human cortex29 (n=2), d, adult human cortex28 (n=7), and e, adult mouse cortex30 (n=5). Top: t-SNE plots of the cell clusters for each dataset. Mutual information (MI) scores represent the dependence between the cluster and the individual (scores range from 0: individuals have the same cluster makeup, to 1: individuals cluster separately). Z-scores represent the divergence of the MI score from the mean MI score expected at random. All datasets downsampled to n=659 cells per sample.