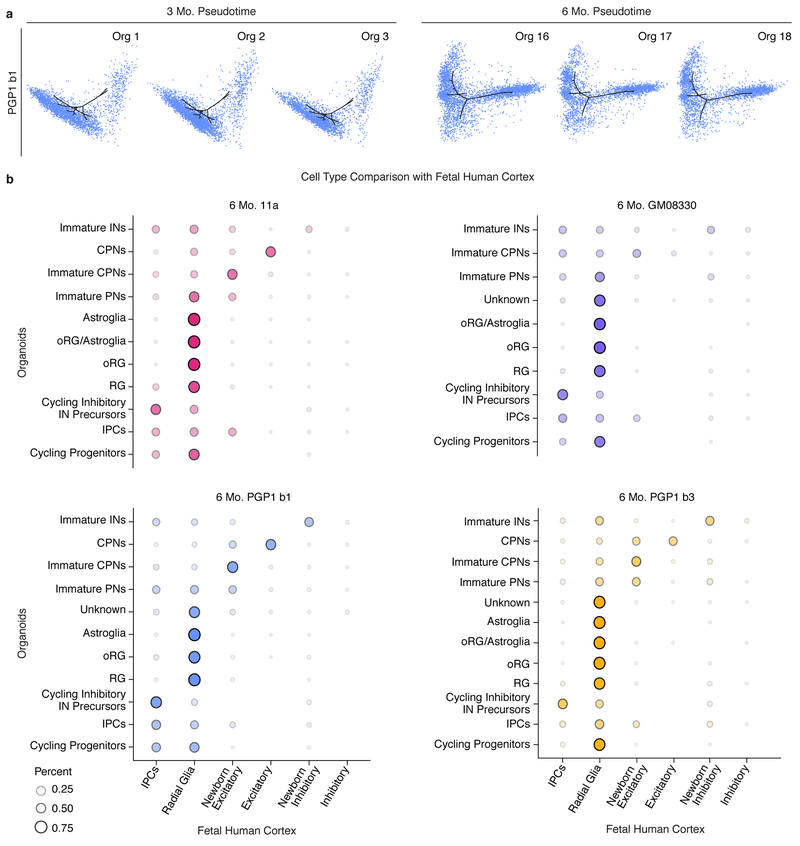
Extended Data Figure 4: Cell types in individual organoids are generated following a precise and reproducible temporal order and are transcriptionally similar to human fetal cortex cell types.
a, T-SNE plots produced by Monocle2 showing the contribution of cells from individual PGP1 (b1) organoids at 3 (n=2,665, 3,094, and 2,264 cells from Orgs 1-3) and 6 months (n=3,959, 2,971, and 3,042 cells from Orgs 16-18) to plots in Fig. 3a–b. b, Agreement between cell type classifications in cell populations of 11a, GM08330, and PGP1 organoids (two batches: b1, b3) at 6 months with cell types described in a previously published single-cell RNA-seq dataset of the human fetal cortex18. Dot size and color intensity indicate the percent of organoid cells in each cell cluster assigned to each human cortex cell type by a Random Forest classifier. Abbreviations as in Figure 1.

