Figure 6.
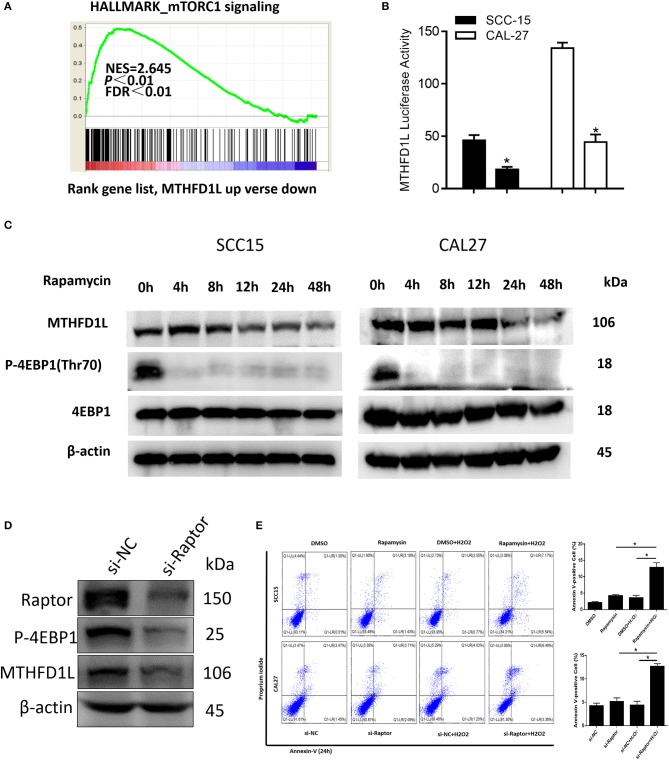
The mTORC1-4EBP1-eIF4E axis may affect the expression of MTHFD1L in TSCC. (A) Gene set enrichment score and distribution of mTORC1 signaling genes along the rank of MTHFD1L up vs. down available from The Cancer Genome Atlas TSCC database. (B) Relative MTHFD1L promoter activity in rapamycin treated TSCC cells (100 nM, 24 h) (*P < 0.05). (C) The expression of MTHFD1L in SCC-15/CAL-27 cell line after rapamycin treated at different time (50 nM). (D) The expression of MTHFD1L in CAL-27 cell line after knockdown of raptor. (E) Cell apoptosis was detected after the treatment of rapamycin or knockdown of raptor expression in TSCC cells (with or without H2O2, 100 μM, 48 h) (*P < 0.05).

