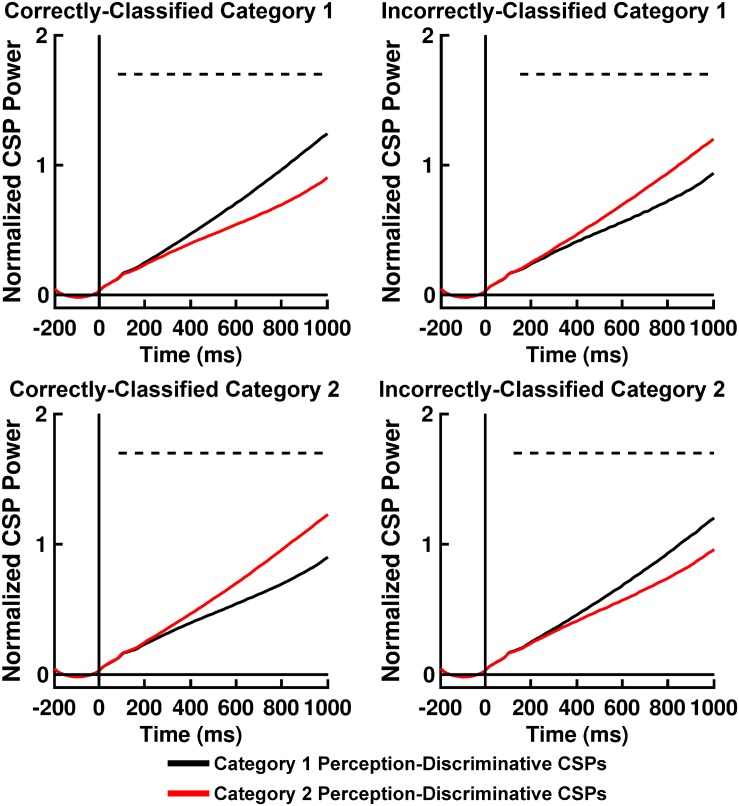
FIGURE 7.
Time courses of mean RB categorization task normalized perception-discriminative Common Spatial Pattern (CSP) activation power for correctly and incorrectly SVM-classified Category 1 trials (top left and right panels, respectively) and for correctly and incorrectly SVM-classified Category 2 trials (bottom left and right panels, respectively). Black lines indicate CSP component brain responses most discriminative for Category 1 perception and least discriminative for Category 2 perceptions; red lines indicate CSP component brain responses most discriminative for Category 2 perceptions and least discriminative for Category 1 perceptions. Dashed lines indicate time periods of statistically significant differences between CSP component power indicated by permutation-based statistical testing corrected for multiple comparisons across time (see section “Analytical Methods, Estimation of Free Energy Difference-Related Brain Responses”).

