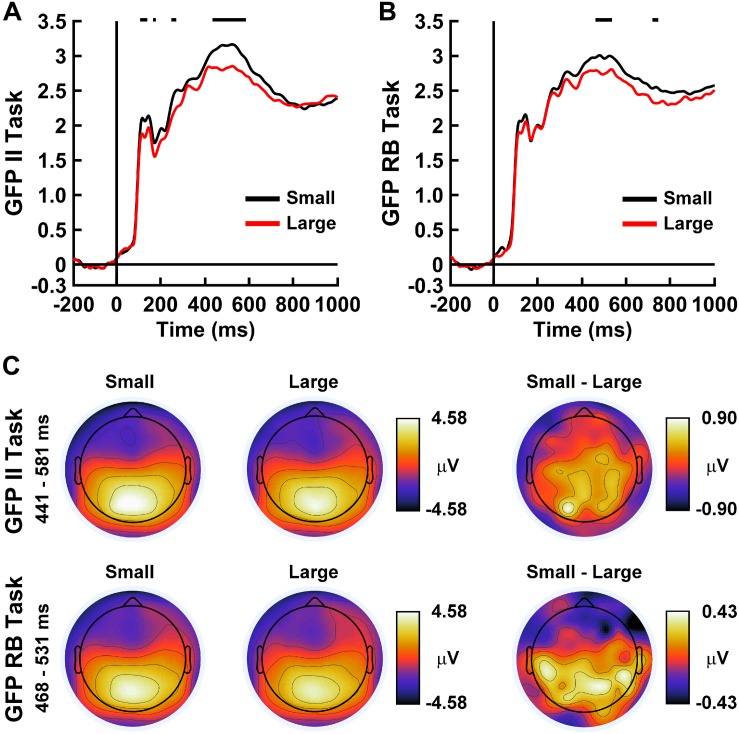
FIGURE 8.
Time courses of ERP global field power (GFP) for (A) the II Task and (B) RB Task for small free energy differences (black lines) and large free energy differences (red lines). GFP values are in μV. Horizontal black lines indicate time ranges demonstrating significant between-condition differences between GFP waveforms as indicated by permutation-based statistical testing corrected for multiple comparisons across time (see section “Analytical Methods” and “Estimation of Free Energy-Related Brain Responses”). (C) Topographical head maps show mean ERP values across the scalp for the indicated free energy differences and between-condition contrasts averaged over the indicated time ranges. The noses of the headmaps point upward; light/dark colors indicate ± values.

