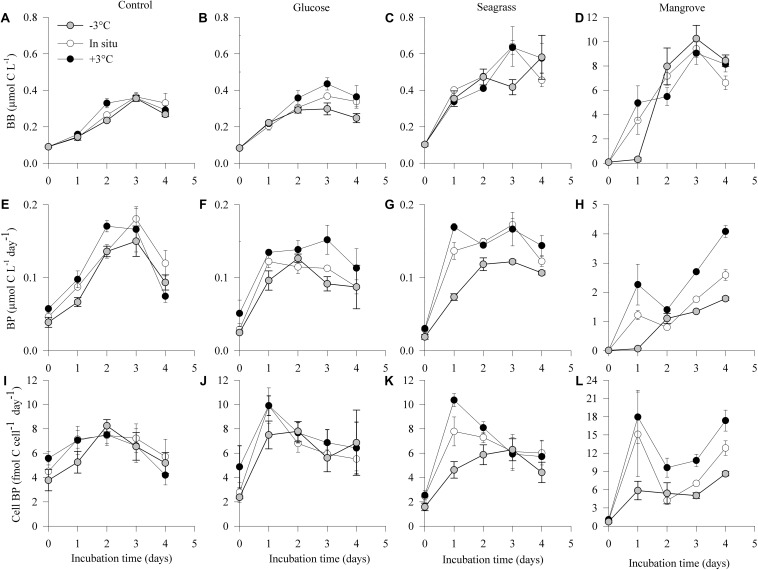
FIGURE 2.
Dynamics of bacterial biomass (BB; A–D), production (BP; E–H), and cell-specific bacterial production (Cell BP; I–L) during the 4 days incubations in the different experiments (control, glucose, seagrass, and mangrove) performed at –3°C ( ), in situ (
 ), and +3°C (
 ). Values are mean values of three replicates and the Error bars represent standard deviations, where not visible error bars are within the symbol. Please note the difference in Y-axis scaling for the mangrove experiment.

