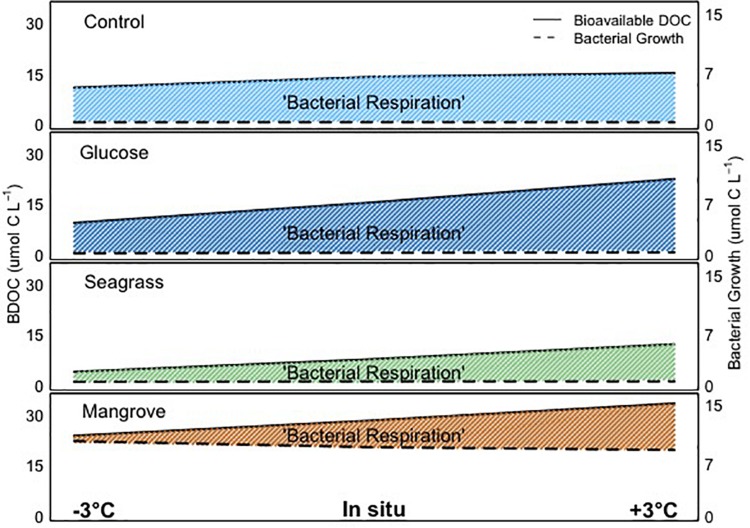
FIGURE 5.
Graphical representation of the bioavailable dissolved organic carbon (BDOC; difference between initial and minimum DOC concentration), bacterial growth and bacterial respiration in all experiments (control, glucose, seagrass, and mangrove), over the range of temperatures (–3°C, in situ, and +3°C). The shaded areas highlight the bacterial respiration, as the difference between bioavailable DOC and bacterial growth. Please note that due to the scale the differences in bacterial growth with temperature are not visible.

