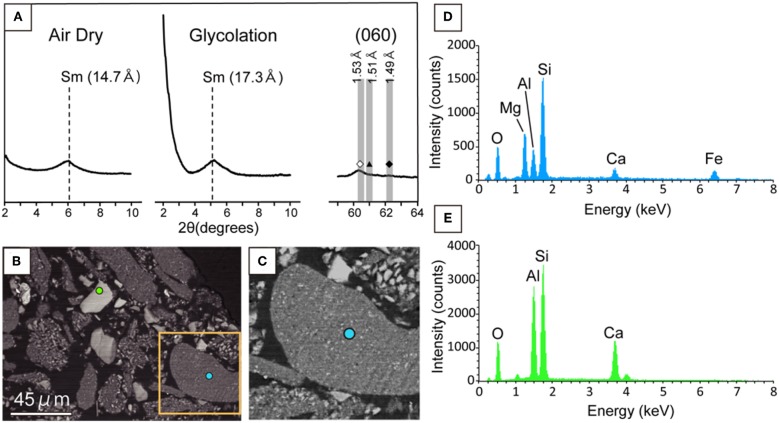
Figure 3.
Mineralogical characterization of the clay fraction separated from a powdered core sample in U1365E-7R2. (A) Low-angle XRD patterns (2θ: 2–10°) from air-dried and ethylene-glycolated samples vertically oriented to the c-axis of phyllosilicate minerals (left and middle). High angle XRD pattern (2θ: 59–64°) including 060 reflections from the randomly oriented sample (right). Sm indicates smectite. In the high-angle XRD pattern, vertical bands show 2θ ranges of 060 reflections from trioctahedral phyllosilicate minerals (left with open diamond), nontronite and celadonite (middle with filled triangle), and dioctahedral phyllosilicate minerals (right with filled diamond; Moslehuddin and Egashira, 1997). (B) Back-scattered electron image of the clay fraction with light blue and light green circles, from which EDS spectra were obtained for the low-contrast phase and the high contrast phase (D,E). An orange rectangle indicates an enlarged area shown in (C). (C) Back-scattered electron image of the enlarged area in (B). (D) EDS spectra from light blue and light green circles in (B).

