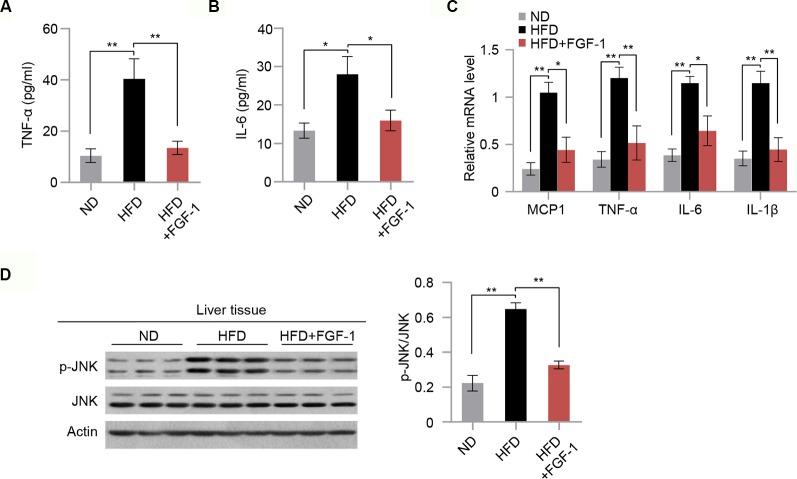
Figure 3.
Potential anti-inflammatory action of FGF-1 in DIO mice. (A–B) Plasma concentrations of pro-inflammatory cytokines TNF-α (A) and IL-6 (B) in ND, HFD, and HFD+FGF-1 group. (C) Relative mRNA levels of hepatic inflammation-related gene expression in liver tissues of ND, HFD, and HFD+FGF-1. (D) Western blot analysis of total liver lysates from ND, HFD, and HFD+FGF-1 groups. Error bars denote SEM. Statistical analysis was performed by ANOVA followed by Tukey in (A–D). *P < 0.05; **P < 0.01. Uncropped blots can be found in Supplementary Figure 5.

