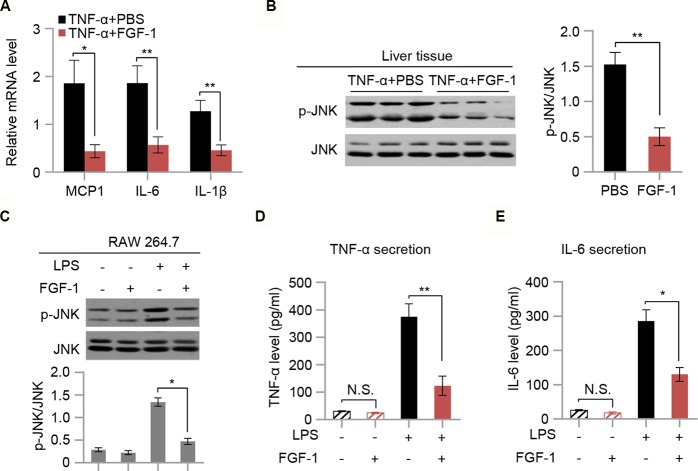
Figure 5.
FGF-1 reduces TNF-α-induced inflammation and LPS-induced cytokine secretion. (A) Relative mRNA levels of hepatic inflammatory-related gene expression in liver tissue of TNF-α-induced insulin resistant mice in response to treatment with FGF-1. (B) Western blot analysis of liver lysates from TNF-α-induced insulin resistant mice treated with FGF-1 or control. (C) RAW 264.7 cells were treated with 100 ng/ml FGF-1 for 1 h prior to 100 ng/ml of LPS treatment for 10 min, and then their lysates were subjected to western blot. Experiments in this figure were performed three times. (D–E) Cytokine secretion was measured in RAW 264.7 cells by ELISA. Error bars denote SEM. Statistical analysis was performed by two-tailed unpaired Student’s t-test in (B) or by ANOVA followed by Tukey in (A) and (C–E). *P < 0.05; **P < 0.01, N.S. not significant. Uncropped blots can be found in Supplementary Figure 5.

