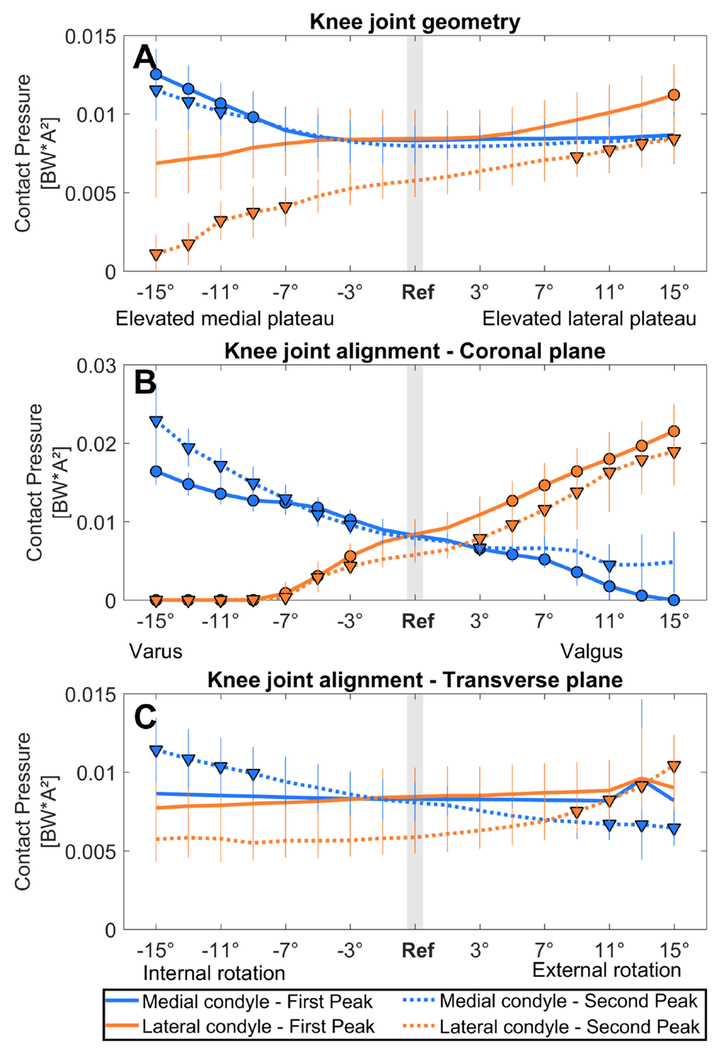
Figure 4. Effect on the contact pressure distribution.
The effect of an altered joint geometry in A) the coronal plane, C) the transverse plane and an altered joint alignment in B) the coronal plane and D) the transverse plane on the knee contact pressure distribution at the first peak (FP, solid line) and at the second peak (SP, dashed line). The blue line shows the effect on the medial condyle contact pressure, and the orange line shows the effect on the lateral condyle contact pressure. A significant difference compared to pressure during the reference simulation (gray bar) is indicated by a solid dot (first peak) and a solid triangle (second peak). (αBC = 0.0031)

