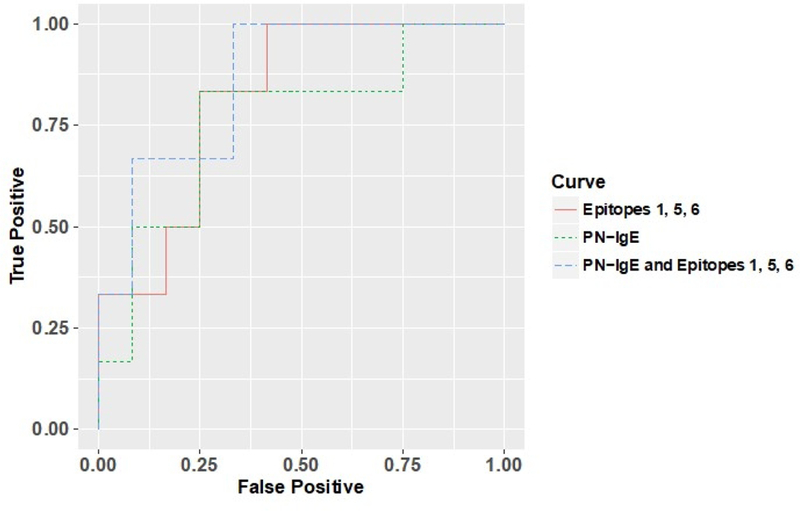
FIGURE 5. Receiving operator curve.

Data are shown for subjects with PN-sIgE of ≥35 kIU/L. An ROC curve for PN-sIgE (green dashed line), cumulative IgE binding to epitopes 1, 5 and 6 of Ara h 2 (orange solid line) and a composite analysis using PN-sIgE and cumulative IgE binding to epitopes 1, 5 and 6 of Ara h 2 (blue dashed line).
