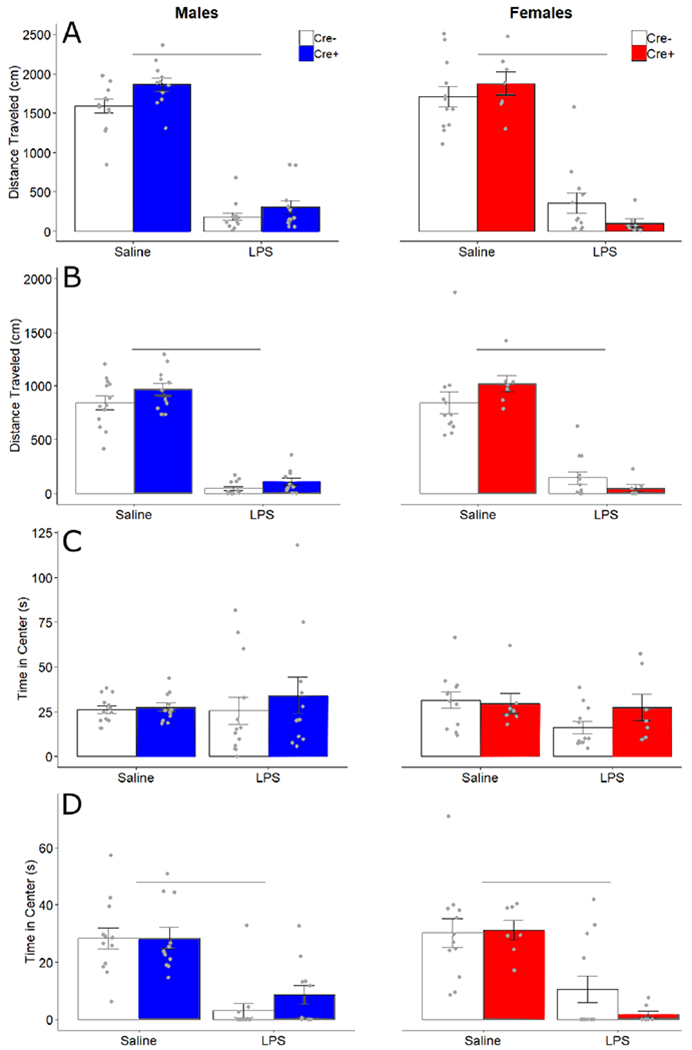
Figure 2.

Open field behavior. Mean ± SEM of total distance (cm) traveled in the early (A) and late (B) exploration phases, and of time (seconds) spent in the center of the open field in early (C) and late (D) exploration phases for male and female Cre− (white bars) and Cre+ (filled bars) mice. Points indicate individual data. Horizontal bars indicate significant differences between treatments.
