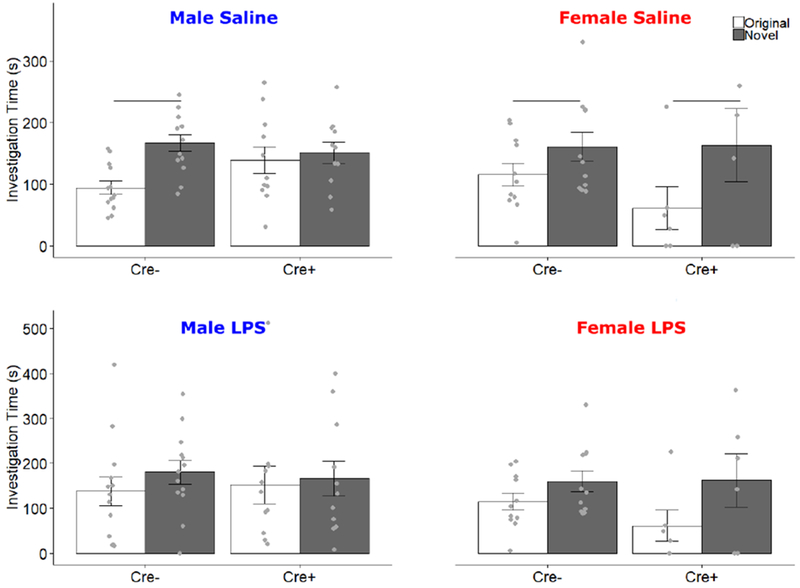
Figure 6.

Social Novelty Preference Test. Data for Saline and LPS treatments are presented separately. Mean ± SEM of active investigation (s) of both original (white bars) and novel (filled bars) same-sex stimulus animals during the social novelty preference test. Points indicate individual data. Horizontal bars indicate investigation differences.
