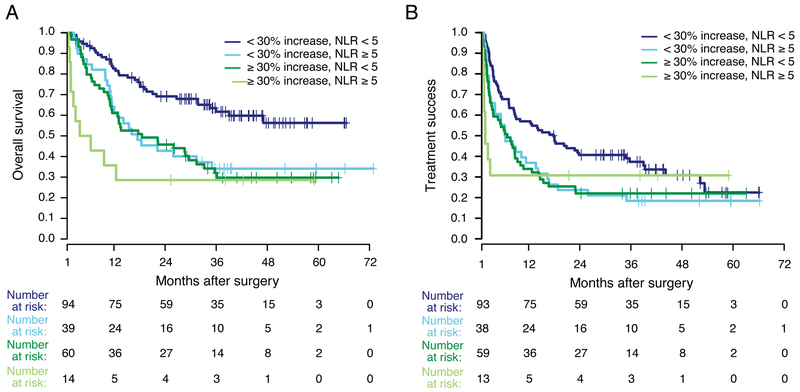
Figure 4. Outcomes stratified by baseline NLR (< 5 or ≥ 5) and change in NLR (< 30% or ≥ 30%) during the first two cycles of PD-1 inhibitor treatment.
A) OS stratified by baseline NLR and NLR increase. B) TTF stratified by baseline NLR and NLR increase. Survival analysis was landmarked at 30 days to include only those patients whose change in NLR during the first two cycles of treatment could be assessed.

