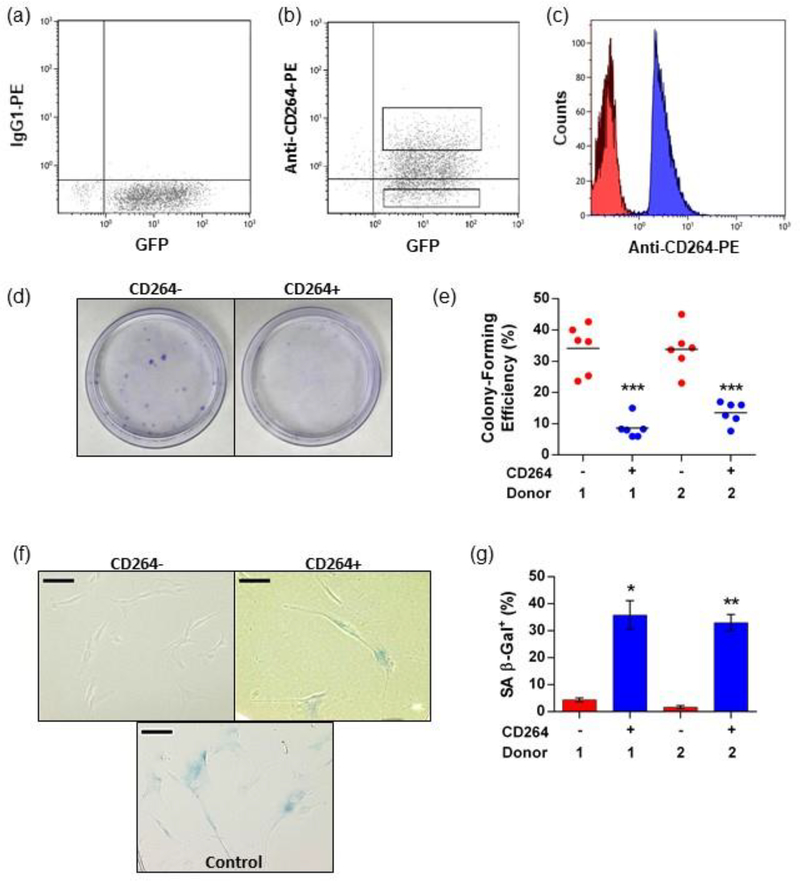
Figure 2.
Quality control analysis of sorted hBM-MSCs and aging CD264 phenotype. P5 eGFP-FLuc hBM-MSCs were sorted using FACS into CD264+ and CD264− populations, and analysis was performed in parallel with in vivo assays. (a, b) eGFP-FLuc hBM-MSCs were surface labeled with anti-CD264-PE monoclonal antibodies and sorted into CD264+ and CD264− groups based on the isotype labeling with the gates shown. (c) Reanalysis of CD264-sorted populations was performed immediately after each sort. (d, e) Colony-forming efficiency was evaluated in 10 cm tissue culture plates using crystal violet staining for CD264+ and CD264− hBM-MSCs from each sort (n = 6 biological replicates per group). Mean values are depicted as bars. (f, g) Select CD264 sorts from both hBM-MSC donors were evaluated for SA β-Gal activity at pH 6.0. Data are reported as mean ± SEM (n = 3 biological replicates). Scale bars: 100 μm. *p <0.05, **p < 0.01, and ***p < 0.0001 vs donor-matched CD264− hBM-MSCs. Abbreviations: 1: donor 1; 2: donor 2; eGFP: enhanced green fluorescent protein; FACS: fluorescence-activated cell sorting; FLuc: firefly luciferase; hBM-MSCs: human bone marrow mesenchymal stem cells; P5: passage 5, PE: phycoerythrin; SA β-Gal: senescence-associated β-galactosidase; SEM: standard error of the mean.

