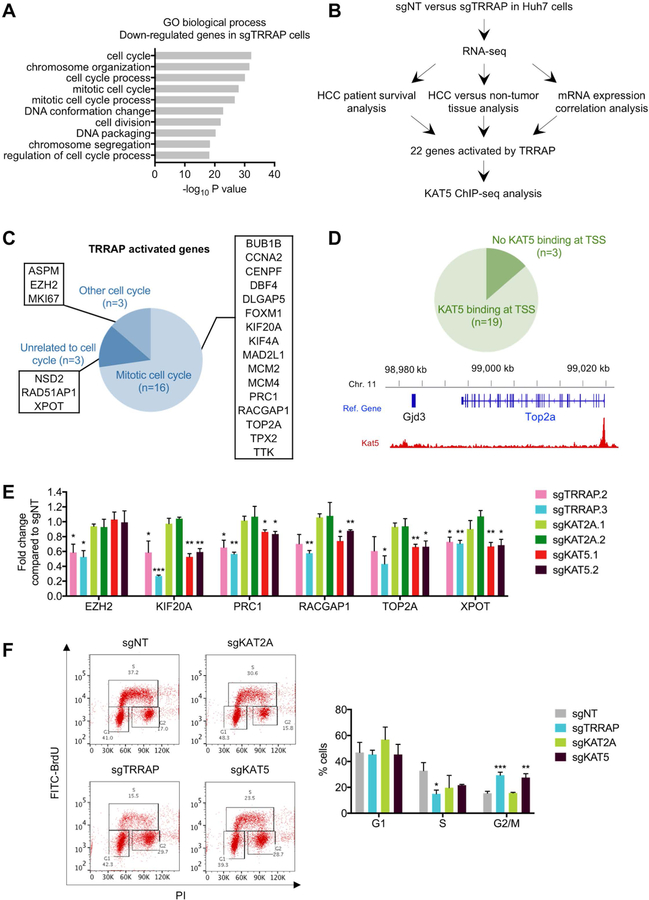
Figure 5. TRRAP/KAT5 activates transcription of mitotic genes and depletion of TRRAP/KAT5 leads to G2/M arrest.
A) Gene ontology (GO) analysis of down-regulated genes in sgTRRAP cells compared to non-targeting control. The 10 most significant annotation clusters are shown here. B) Pipeline for identifying HCC-relevant TRRAP target genes. C) GO analysis of the 22 TRRAP-activated genes identified in B. D) KAT5 binding analysis at the transcriptional start sites (TSS) of the 22 TRRAP-activated genes using published ChIP-seq data (top). KAT5 binds to the TSS of TOP2A (bottom). E) mRNA levels of 6 TRRAP-activated genes in Huh7 cells infected with the indicated sgRNAs as measured by qRT-PCR. F) Cell cycle analysis of Huh7 infected with the indicated sgRNAs by BrdU and PI staining. Representative data (left) and quantification (right) are shown here. Data was presented as mean ± SD; p-values were calculated by comparing to non-targeting control, *p < 0.05, **p < 0.01, ***p < 0.001 (student’s t test).

