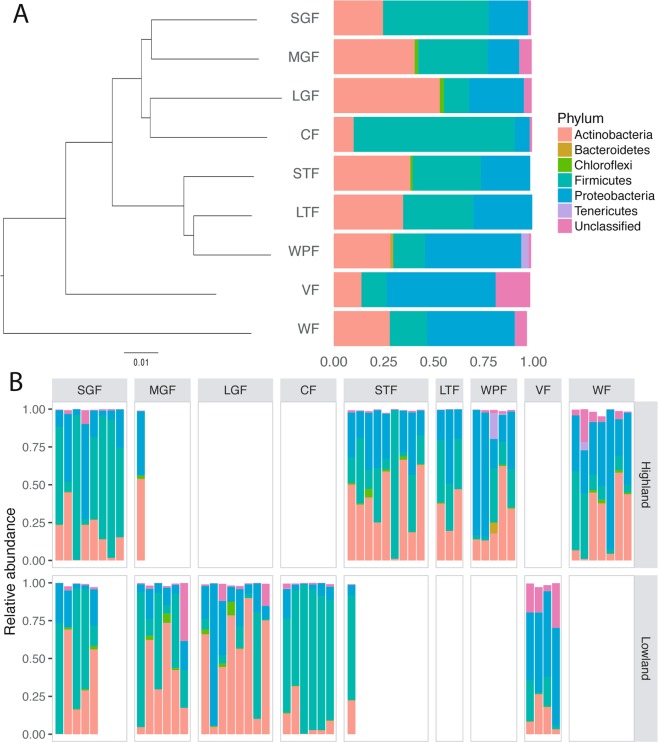
Figure 1.
Relative abundance of bacterial phyla in the gut microbiota of Darwin’s finch species. (A) Phylogeny of Darwin’s finch species on Santa Cruz island based on whole-genome resequencing18 and the mean relative abundance of bacterial phyla across all gut microbiome samples of each species. Species abbreviations in this and all subsequent figures are given in Table 1. (B) Relative abundance of the bacterial phyla in individual microbiome samples grouped according to species and habitat. Any bacterial taxa with mean relative abundance within species below 1% was omitted from both plots.

