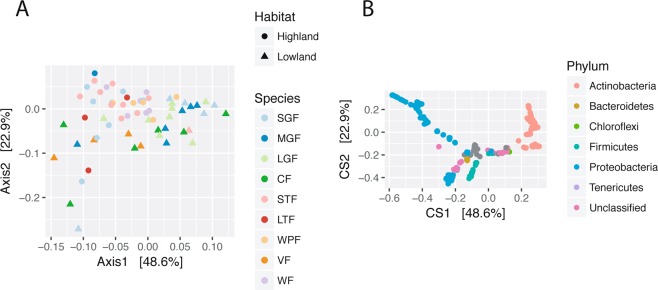
Figure 2.
Double principal coordinate analysis (DPCoA) of Darwin’s finch gut microbiome communities. (A) Gut microbiome samples are plotted on the first two principal coordinate axes annotated with explained variance, with point color and point shape indicating host species and habitat, respectively. A clear demarcation between highland and lowland samples can be seen along the first axis, with highland samples and lowland samples mostly to the left and right, respectively. (B) Individual amplicon sequence variants (ASVs) are plotted in the same ordination space as the gut microbiome samples, with principal coordinate axes annotated with explained variance. Bacterial phyla with at least 1% relative abundance across samples are color-coded; all other ASVs are gray. The demarcation between highland and lowland samples seen in A is recapitulated by the ASVs, with Proteobacteria and Actinobacteria corresponding to highland (left) and lowland (right) samples, respectively.

