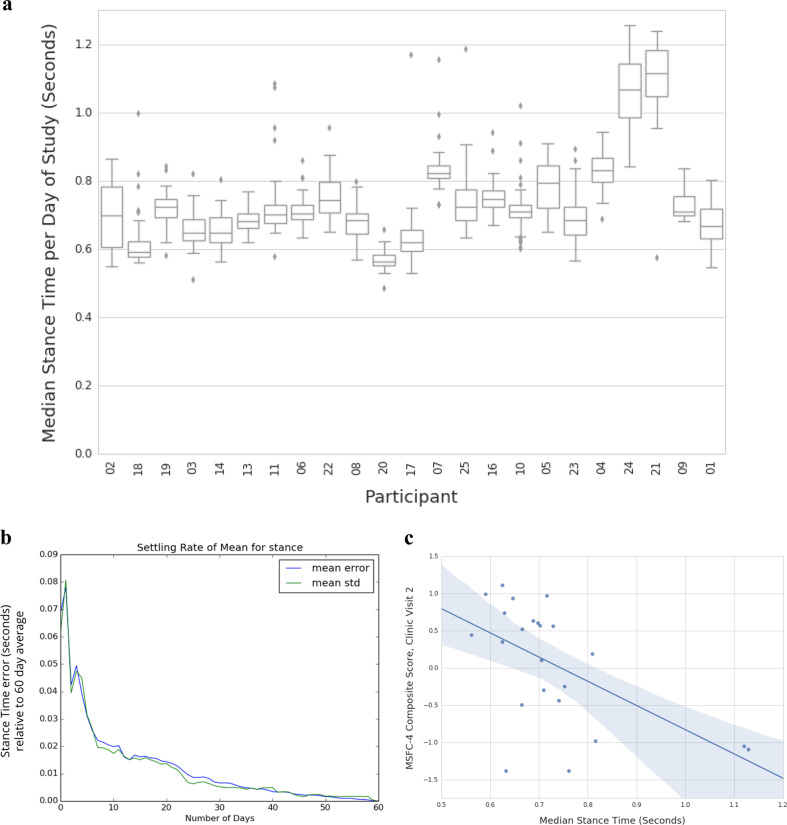
Fig. 2.
Properties of free-living mobility measures extracted during classified walking periods. a Box and whiskers plots representing the distribution of daily stance time measures for that subject across each of the 56 days of measurement during the study; subjects are sorted by MSFC-4 clinic visit 2 scores. b Variability of the Stance time median value by number of days of observation within subjects. A variable number of days (from 1 up to all 56 + days) was compared to the overall study time median, demonstrating how averaging different ranges of data can help control for the overall variability. With 1 week’s worth of data, the standard error for stance time is within 0.02 s compared to 0.08 s with just 1 day’s worth of data. c Spearman correlation for median stance time, calculated across the entire 8-week free-living period; there is a correlation (−0.56, q-value = 0.0052) between this free-living measure and the MSFC-4 composite score at visit 2.

