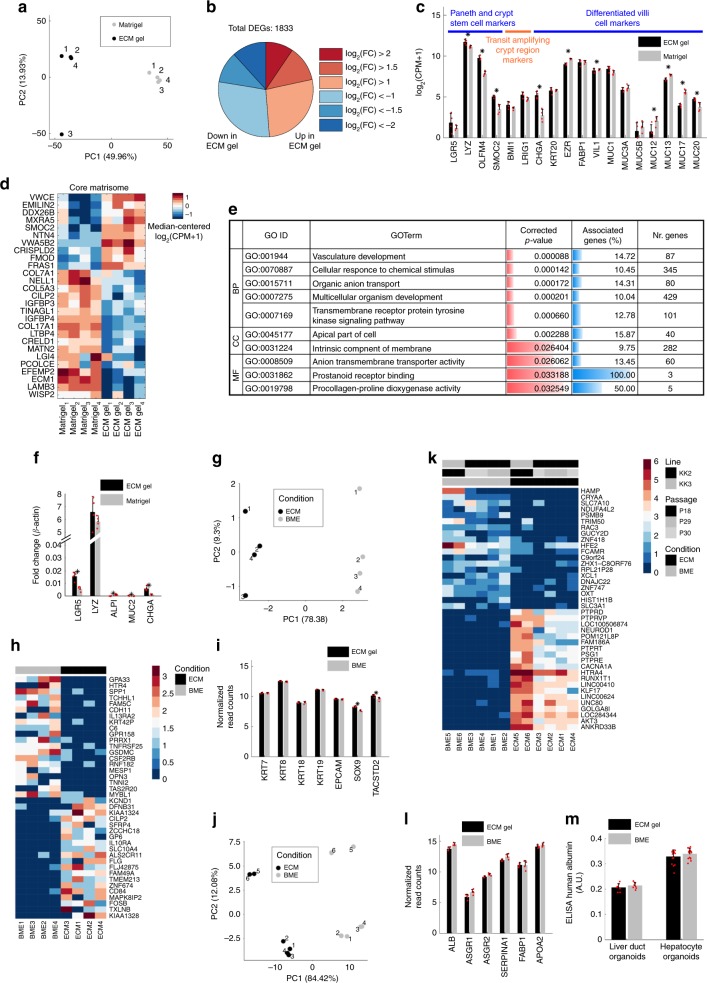
Fig. 4. Transcriptomic analysis results of different ECM organoids.
a–e Pediatric SI organoids. a PCA analysis. b Number of DEGs upregulated and downregulated in ECM compared to Matrigel for different absolute log-fold change ratios. c Expression of genes selected for their involvement in the indicated processes. Mean ± S.D. (n = 4 biological replicates). Black asterisks indicate DEGs. d Heat map of expression of core matrisome DEGs ordered according to hierarchical clustering. Supplementary Fig. 6a reports the corresponding analysis for matrisome-associated transcripts. e Selected GO categories enriched in DEGs between ECM and Matrigel involved in the interaction of cells with the extracellular space. Full results are reported in Supplementary Data 2 and Supplementary Fig. 6b. f Real-time PCR analysis of SI transcripts. Mean ± SEM (n = 4 biological replicates). Two-sided t-test p-value < 0.05. g PCA plot on human ductal liver organoids cultured in ECM gel vs BME. h Heat map of top 20 upregulated and top 20 downregulated genes ECM gel vs BME ductal organoids. i Ductal liver transcripts plot comparison in ECM gel vs. BME. Mean ± S.D. (n = 4 biological replicates). Black asterisks indicate DEGs. j PCA plot on human fetal hepatocyte organoids cultured in ECM gel vs. BME. k Heat map of top 20 upregulated and top 20 downregulated genes ECM gel vs BME hepatocyte organoids. l Hepatic transcripts plot comparison in ECM gel vs. BME. Mean ± S.D. (n = 4 biological replicates). m Comparison of ALB expression in ductal and hepatocyte organoids by ELISA assay. Mean ± S.D. (n = 3 biological, with four technical replicates each). Red dots on the bar charts represent single data points throughout the figure.

