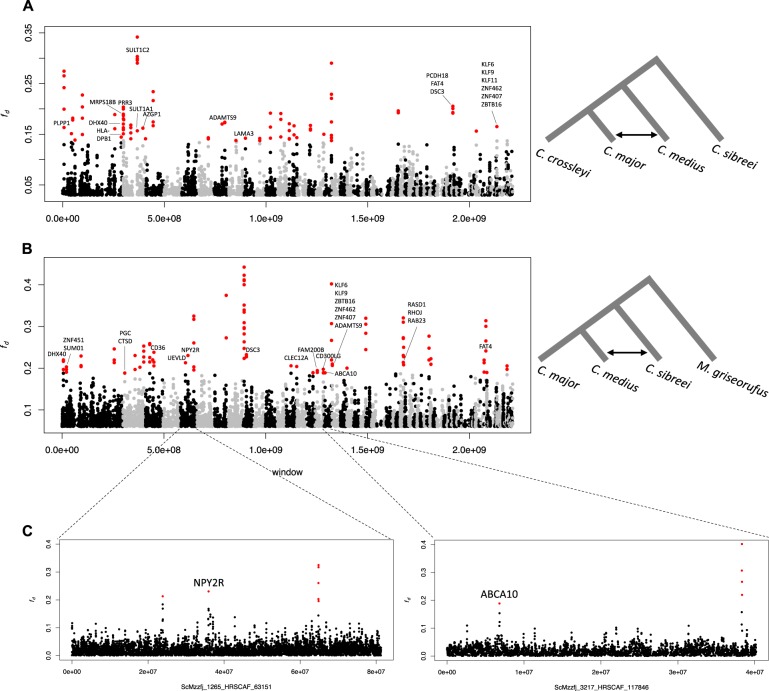
Fig. 3.
Fd test for introgression plotted across the genome. Fd statistic computed in 40-kb windows with a 10-kb sliding window, with the full phylogeny and associated test indicated on the right. Scaffolds are arranged from largest to smallest, alternating in colour. ‘Significant regions' are shown in red. Hibernation-related genes are labelled. a Results from a test of introgression between Cheirogaleus sp. cf. medius and C. major (C. med/C. maj). b Results from a test of introgression between C. sp. cf. medius and C. sibreei (C. med/C. sib). c Isolated scaffolds of interest

