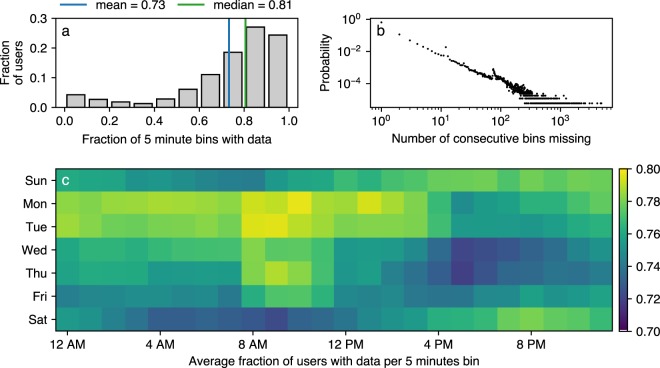
Fig. 2.
Statistics on data quality. (a) Missing data per user. The data availability – measured as the fraction of 5 minute timebins in which data is available – varies across users. Half of the users have at least 81% of data available. (b) Distribution of time-bins with missing data. Most commonly only a few bins are missing. The visible peak at 12 bins, corresponds to 1 hour of data—the interval at which the phones moved collected data into encrypted files—and could be caused by file corruption on the device. (c) Data availability across the week. The data availability is the highest during working hours, when the majority of interactions occur.

