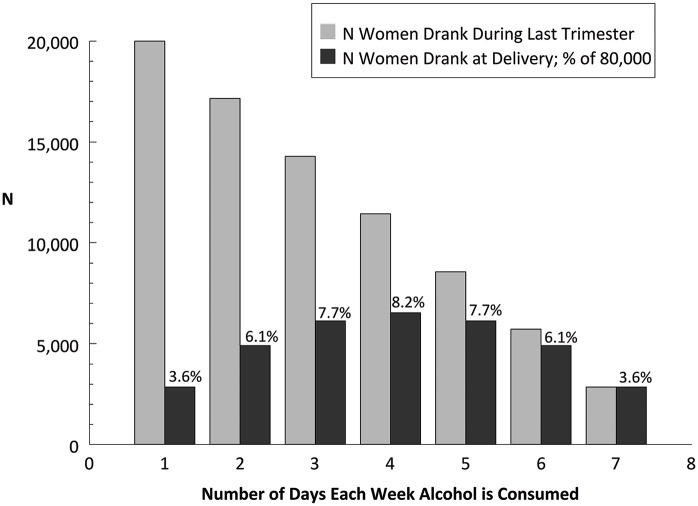
Figure 2.
A model of women drinking near delivery. In this hypothetical model, we assume that the number of women drinking only 1 day a week is more than the number of women drinking 7 days a week (it decreases linearly). The solid bars decrease from left to right (20 000 to 2857) as the number of drinking days per week increases.

