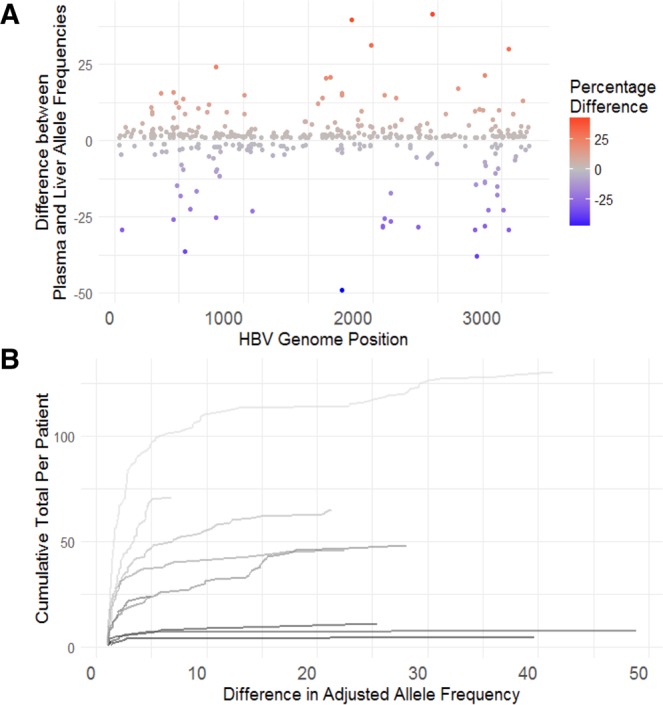
Figure 2.

Allele frequency differences between liver and plasma. (A) Percentage differences (y-axis) in allele frequency between variants found more abundantly in the plasma (red points, positive values) or liver (blue points, negative values); HBV genome nucleotide positions defined by the x-axis. (B) Cumulative frequency plot for difference (>1%) in allele frequency for variants in n = 10 paired liver and plasma samples - each trace represents the running total trace for the frequency of variants with a defined difference in a allele frequency between liver and plasma samples. The majority of variants found in liver and plasma only show small differences in the adjusted allele frequency (1–2 percentage points) as demonstrated by the steep rise of traces in most patients. Few variants (n = 56) show differences >10% across all samples.
