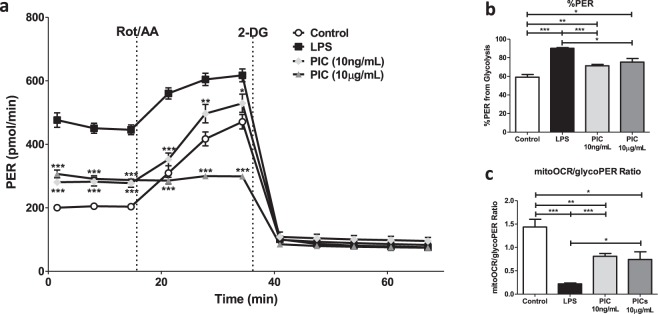
Figure 2.
Macrophages activated using higher concentrations of Poly(I:C) are functioning near their maximum glycolytic capacity. BMMs were seeded onto Seahorse XFp miniplates and treated with 100 ng/mL LPS, 10 ng/mL or 10 μg/mL PIC for 18 hours. Glycolytic activity, indicated by the proton efflux rate (PER) was measured using sequential injections of rotenone plus antimycin A (Rot/AA) and 2-deoxyglucose (2-DG) (a), determining the %PER dependent on glycolysis (b) and the ratio of mitochondrial oxygen consumption rate (mitoOCR) to glycolytic PER (c). Data represents mean ± SEM of four individual mice. The levels of significance shown in (a) represent pairwise comparisons against LPS-treated macrophages (*p < 0.05, **p < 0.01, and ***p < 0.001).

