Figure 7.
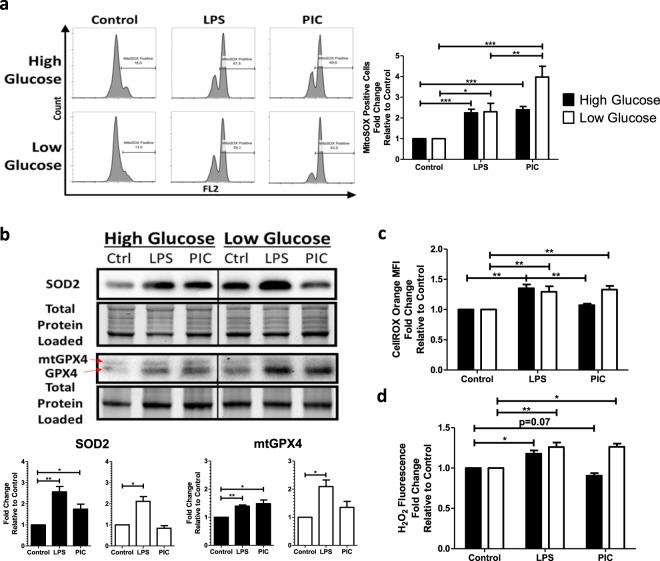
Poly(I:C) activation promotes mitochondrial ROS production and accumulation. Macrophages treated either with LPS or PIC for 18 hours under high glucose or low glucose media conditions were examined for differences in redox metabolism. Mitochondrial superoxide production was measured using MitoSOX RedTM (a). Protein levels of antioxidant proteins superoxide dismutase (SOD2) and mitochondrial glutathione peroxidase 4 (mtGPX4) were measured via immunoblotting (b). Cytosolic ROS production was measured using CellROX Orange (c). Hydrogen peroxide levels were quantified using the Cell-based Hydrogen Peroxide Assay kit (d). Data represents mean ± SEM of four individual mice (*p < 0.05, **p < 0.01, and ***p < 0.001). For visualization purposes, the western blot images were cropped, but full-length blots and gel images can be found in Supplemental Fig. S7.

