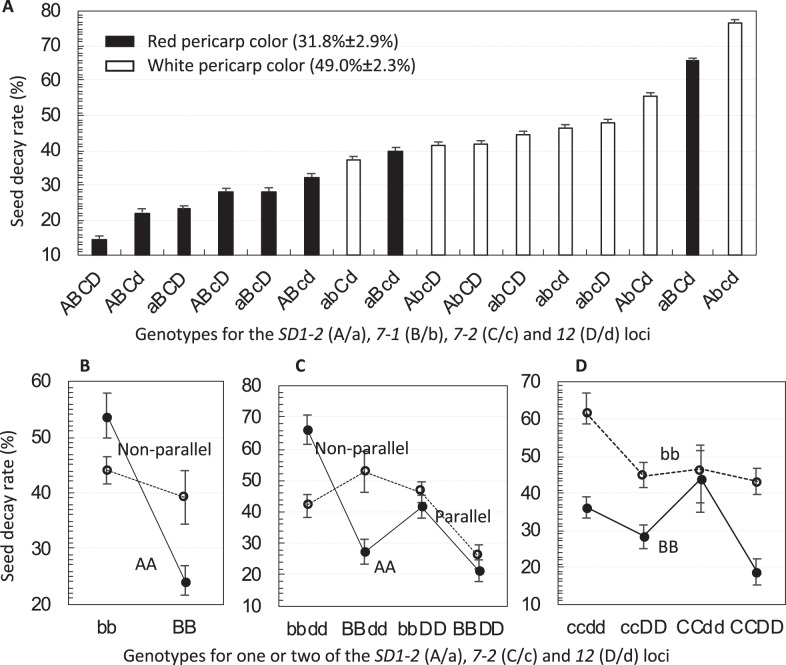
Fig. 3.
Genotypic variation in the seed decay rate among the 16 lines. a Sorted genotypic differences. The 16 lines are genotypes homozygous for SD1-2 (A/a), 7-1 (B/b), 7-2 (C/c) and 12 (D/d), and indicated by combinations of the dormancy-enhancing/-reducing (upper/lower case) alleles at the four loci. Data shown are genotypic means (columns) and standard errors (bars) of five seed samples buried in a rice field for 7 months. b–d Two- or three-order interaction patterns

