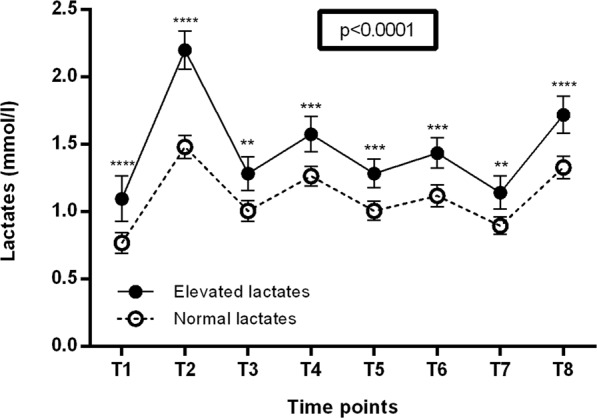
Figure 2.

Comparison between the overall blood lactate levels in the elevated lactate group and the normal lactate group. Notes: The solid line represents the curve of blood lactate of the elevated lactate group, and the dotted line represents the curve of blood lactate of the normal lactate group. Blood lactate concentrations were measured for each patient at 8 time points on a one-day period: T1 = before breakfast after overnight fasting for 16 hours; T3, T5, and T7 = 30 minutes before lunch, 4 pm snack, and dinner at 4-hour intervals; T2, T4, T6, T8 = 1 hour after the 4 meals. The comparison of both curves was realized by a 2-way ANOVA, and the numerical p-value on the graph is tied to the interaction factor. Lactate values are presented as means with 95% confidence interval. Post-hoc analyses for each lactate time point were realised with Bonferroni corrected t-tests and p-values of these tests were summarised as following: **p < 0.01, ***p < 0.001 and ****p < 0.0001.
