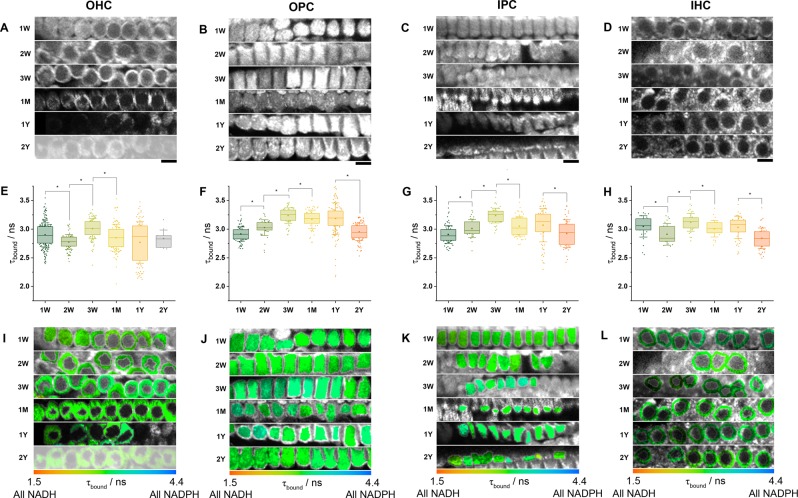
Figure 3.
Development and ageing cause distinct patterns of τbound variation in HCs and PCs. (A–D) NAD(P)H fluorescence intensity images of each cell type at varying postnatal ages (scale bar 10 µm). (E–H) Mean enzyme bound NAD(P)H fluorescence lifetimes τbound (*P < 0.05). (I–L) FLIM images colour coded for the mean τbound value in each cellular region of interest. OHC data is truncated at 1Y due to early-onset hearing loss in C57BL/6 mice.

