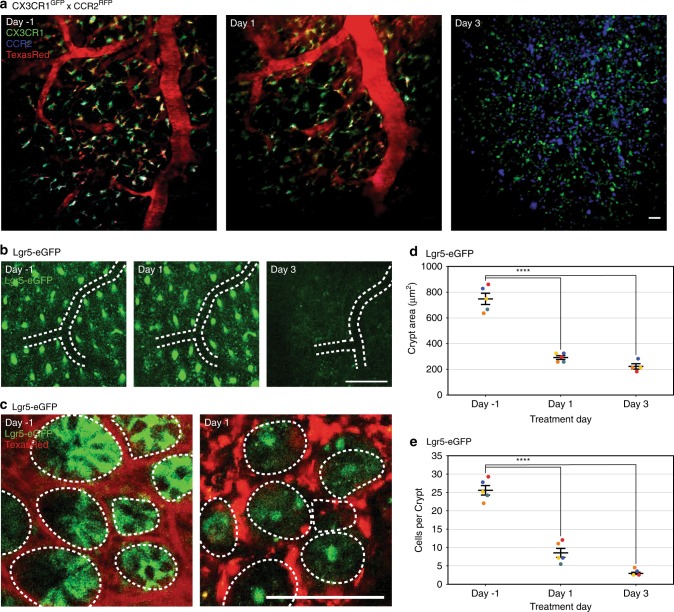
Fig. 3. In vivo imaging of the same location over time via the colonic window.
a Representative images from a CX3CR1GFP × CCR2RFP mouse before and after DSS treatment (administered on Day 0). Using a combination of tattoo and vascular mapping we track innate dendritic cells and inactivated monocytes (green), activated monocytes (blue), and vasculature (red) in the same position for 5 days. b Representative images from a Lgr5-eGFP mouse before and after irradiation (treated on Day 0), demonstrating reduction in colonic crypts (green) after irradiation. Location is tracked by tattoo and vasculature branch points (white dashed lines) without vasculature dye. c Representative images from a Lgr5-eGFP mouse before and after irradiation with individual Lgr5-positive cells (green) and crypts labeled (white dashed lines). Location is tracked by tattoo and vasculature (red). d, e Quantification of Lgr5-positive d) crypt area (μm2) and e) cells per crypt after irradiation (administered on Day 0). Circles represent individual mice by color, and bars indicate μ ± s.e.m. Star indicates statistically significant difference from control by Dunnett’s test for multiple comparisons after repeated-measures ANOVA (n ≥ 4, p < 0.001). All scale bars are 100 μm.

