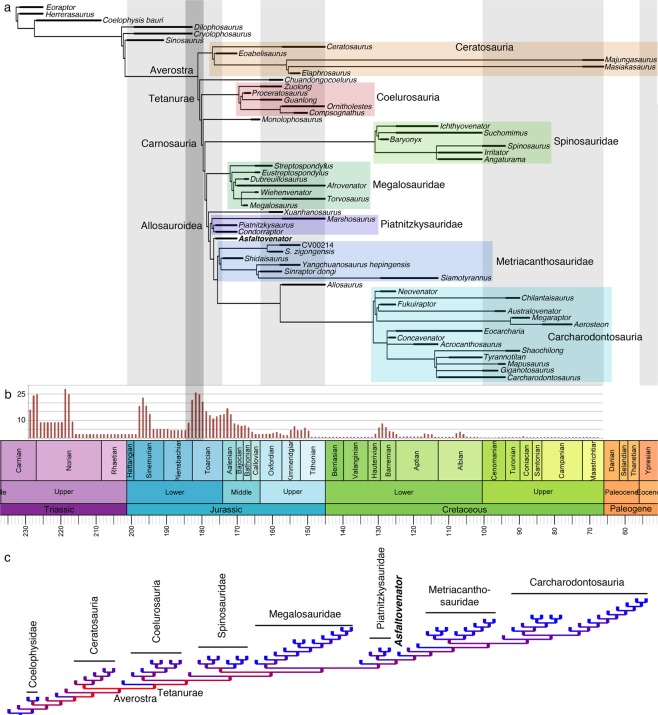
Figure 4.
Phylogenetic position of Asfaltovenator and analysis of homoplasy distribution in tetanuran phylogeny. (A) time calibrated reduced consensus tree. (B) distribution of homoplasy over time in tetanuran evolution. Numbers refer to average number of homoplasies per one million year time bin. (C) colour-coded tree showing the concentration of homoplasy at the base of Tetanurae (red; see Supplementary Information for details). The grey line in (A,B) indicates the Pliensbachian-Toarcian extinction event.

