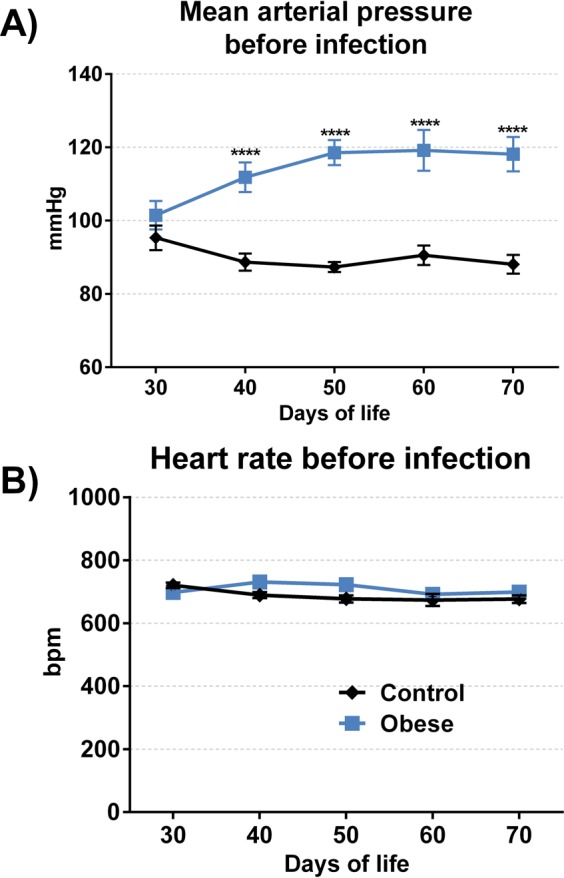
Figure 2.

Cardiovascular parameters during development of obesity. The analysis of cardiovascular parameters began in 30th of life of mouse and repeated every 10 days until 70th of life, using the Coda Platform. The mean arterial pressure (A) was expressed in millimeters of mercury (mmHg) and the heart rate (B) was expressed in beats per minute. Data show mean ± SEM. ****p < 0.0001 when compared control group vs obese group. The number of animals used was: 30 control and 23 obese mice.
