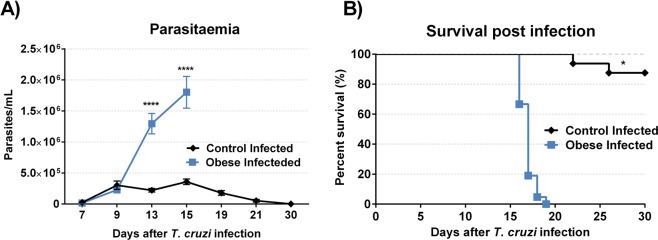
Figure 3.
Effect of obesity on time course of T. cruzi infection in mice. Parasitemia and survival were determined after infection. The parasitaemia (A) started on 7th day and ended on 30th day after infection. Data show mean ± SEM. ****p < 0.0001 when compared control infected vs obese infected mice. The survival rates (B) was evaluated on the same mice used in parasitaemia and was determined by Gehan-Breslow-Wilcoxon test. *p < 0.05 comparing control infected with obese infected group. For this experiment were used 15 mice per group.

